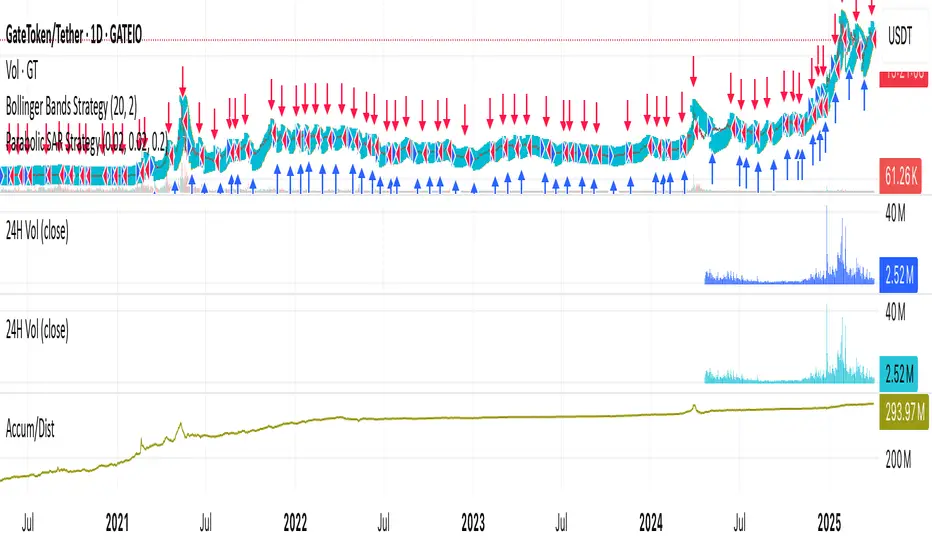
The formation of a golden cross in the oversold zone on GT's weekly StochRSI signals a strong bullish trend, targeting $100. The break above the descending pressure line from prior highs indicates reduced resistance and enhanced upside potential. The daily chart's multiple bullish candles highlight the dominance of buying pressure. Limited selling volume during potential pullbacks suggests shallow corrections and ongoing bullish sentiment. This technical landscape supports initiating long positions in GT, with a take-profit at $100 and a stop-loss range of $22 to $22.5.
Disclaimer
The information and publications are not meant to be, and do not constitute, financial, investment, trading, or other types of advice or recommendations supplied or endorsed by TradingView. Read more in the Terms of Use.
Disclaimer
The information and publications are not meant to be, and do not constitute, financial, investment, trading, or other types of advice or recommendations supplied or endorsed by TradingView. Read more in the Terms of Use.