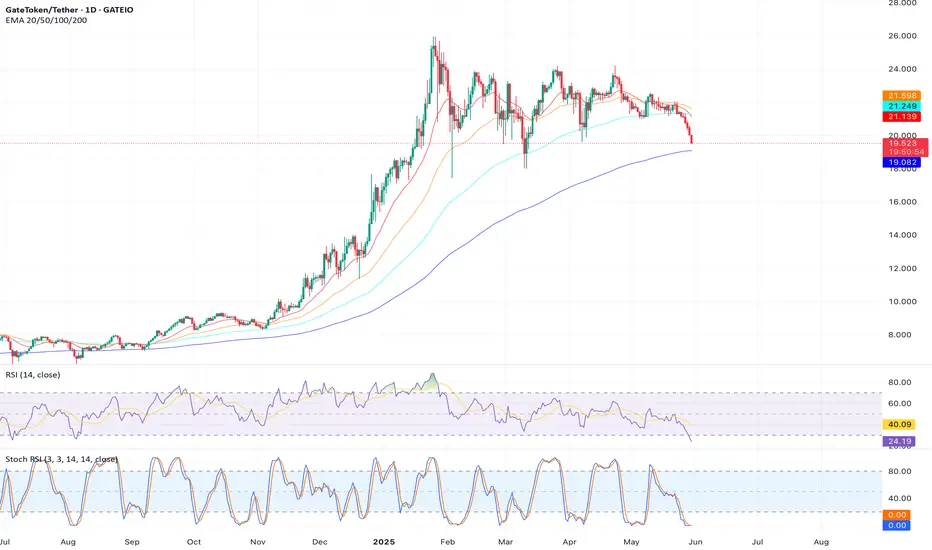
Analysis: GT’s weekly chart shows an inverted Adam & Eve pattern, with a pointed top in 2021 and a rounded top in 2024, signaling a bearish reversal. Trading volume is declining, and the price is below the 200-day SMA ($20.60). A drop to $18.00 is likely if $19.55 breaks.
Trade Idea: Short at $19.50, targeting $18.00. Stop loss at $21.00.
Risk: A close above $21.66 could push GT toward $25.
Trade Idea: Short at $19.50, targeting $18.00. Stop loss at $21.00.
Risk: A close above $21.66 could push GT toward $25.
Disclaimer
The information and publications are not meant to be, and do not constitute, financial, investment, trading, or other types of advice or recommendations supplied or endorsed by TradingView. Read more in the Terms of Use.
Disclaimer
The information and publications are not meant to be, and do not constitute, financial, investment, trading, or other types of advice or recommendations supplied or endorsed by TradingView. Read more in the Terms of Use.