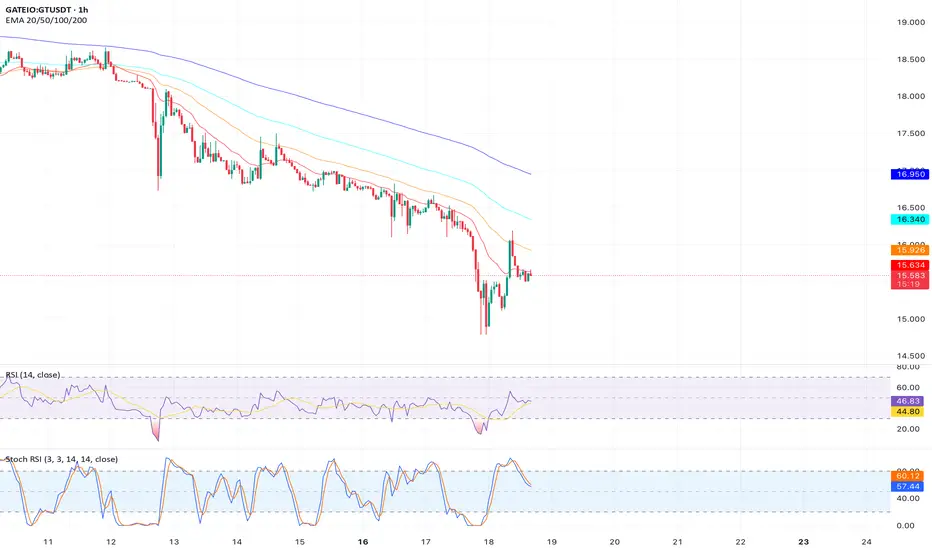
Analysis: On the weekly chart,  GT is forming an inverted Adam & Eve pattern, a bearish reversal signal. The price is below the 20-week SMA ($15.90), and trading volume is decreasing on rebounds, indicating reduced buyer interest. A break below $15.30 could trigger a sharp decline.
Key Levels:
Support: $14.50, $13.50
Resistance: $15.60, $16.00
Target: $13.50
Outlook: Short on a break below $15.30 with a stop loss above $15.90. Target $13.50 for a 13%+ decline. Watch for volume spike on the breakdown.
Key Levels:
Support: $14.50, $13.50
Resistance: $15.60, $16.00
Target: $13.50
Outlook: Short on a break below $15.30 with a stop loss above $15.90. Target $13.50 for a 13%+ decline. Watch for volume spike on the breakdown.
Disclaimer
The information and publications are not meant to be, and do not constitute, financial, investment, trading, or other types of advice or recommendations supplied or endorsed by TradingView. Read more in the Terms of Use.
Disclaimer
The information and publications are not meant to be, and do not constitute, financial, investment, trading, or other types of advice or recommendations supplied or endorsed by TradingView. Read more in the Terms of Use.