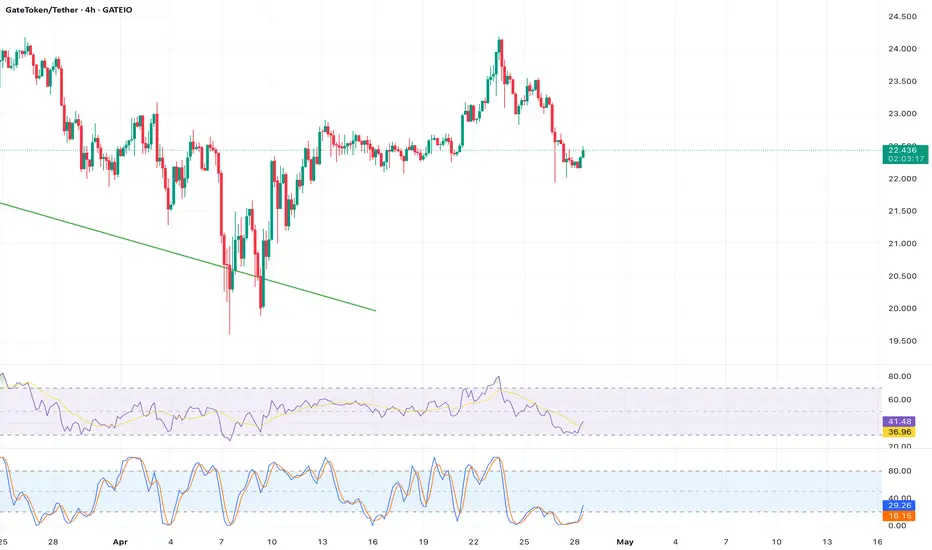
Analysis:  GT at $22.44 has formed a doji candlestick on the 4-hour chart, signaling indecision near the pivot point ($22.523). The CCI is at +40, indicating neutral momentum with a risk of reversal. Support at $21.655 (S3) is critical if selling pressure increases, as per WalletInvestor’s pivot levels. X posts suggest traders are awaiting a breakout or breakdown. The ATR (~0.65) indicates moderate volatility. Traders should wait for a close above $22.773 (R1) or below $22.214 (S1) before entering.
Indicators: Doji Candlestick, CCI (+40), Pivot Point ($22.523), Support ($21.655), Resistance ($22.773).
Indicators: Doji Candlestick, CCI (+40), Pivot Point ($22.523), Support ($21.655), Resistance ($22.773).
Disclaimer
The information and publications are not meant to be, and do not constitute, financial, investment, trading, or other types of advice or recommendations supplied or endorsed by TradingView. Read more in the Terms of Use.
Disclaimer
The information and publications are not meant to be, and do not constitute, financial, investment, trading, or other types of advice or recommendations supplied or endorsed by TradingView. Read more in the Terms of Use.