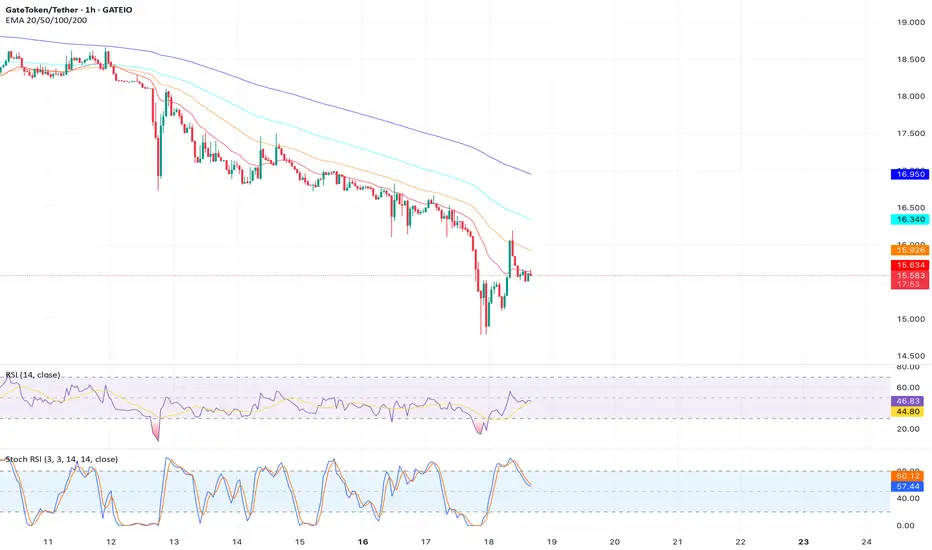
Analysis: On the 4-hour chart,  GT is forming a head and shoulders pattern with a neckline at $15.50. The price is trading below the 20-day SMA ($15.70), and the Stochastic Oscillator is in overbought territory, signaling a potential reversal. A breakdown below $15.50 could accelerate selling.
Key Levels:
Support: $14.50, $14.00
Resistance: $15.50, $16.00
Target: $14.00
Outlook: Short on a break below $15.50 with a stop loss above $16.00. Target $14.00 for a 10% drop. Watch for confirmation via increased volume on the breakdown.
Key Levels:
Support: $14.50, $14.00
Resistance: $15.50, $16.00
Target: $14.00
Outlook: Short on a break below $15.50 with a stop loss above $16.00. Target $14.00 for a 10% drop. Watch for confirmation via increased volume on the breakdown.
Disclaimer
The information and publications are not meant to be, and do not constitute, financial, investment, trading, or other types of advice or recommendations supplied or endorsed by TradingView. Read more in the Terms of Use.
Disclaimer
The information and publications are not meant to be, and do not constitute, financial, investment, trading, or other types of advice or recommendations supplied or endorsed by TradingView. Read more in the Terms of Use.