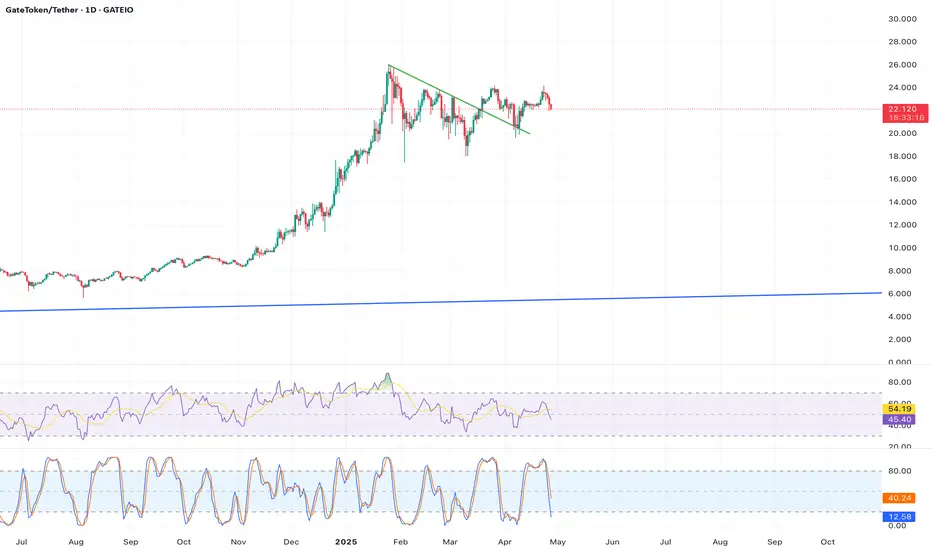
Description: On the 2-hour chart,  GT is forming a symmetrical triangle with converging trendlines, with the current price of $22.145 near the apex. The MACD is flat, indicating indecision, but a breakout above $22.50 or below $21.66 will determine direction. Volume is decreasing, typical before a breakout. Given the bullish market sentiment, an upside breakout is more likely.
Key Indicators/Patterns: Symmetrical triangle, MACD, volume contraction.
Price Target: An upside breakout could target $23.50 within 2-4 days; a downside break could see $21.15.
Timeframe: 2-4 days.
Source Reference: (MACD), (resistance/support levels).
Key Indicators/Patterns: Symmetrical triangle, MACD, volume contraction.
Price Target: An upside breakout could target $23.50 within 2-4 days; a downside break could see $21.15.
Timeframe: 2-4 days.
Source Reference: (MACD), (resistance/support levels).
Disclaimer
The information and publications are not meant to be, and do not constitute, financial, investment, trading, or other types of advice or recommendations supplied or endorsed by TradingView. Read more in the Terms of Use.
Disclaimer
The information and publications are not meant to be, and do not constitute, financial, investment, trading, or other types of advice or recommendations supplied or endorsed by TradingView. Read more in the Terms of Use.