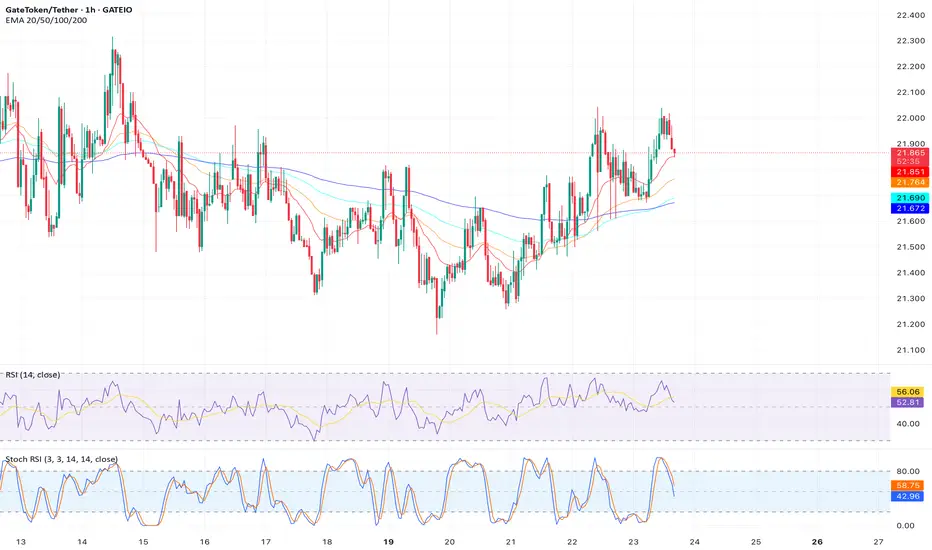
Analysis:  GT has recently broken above the $20.50 resistance level with strong volume, suggesting bullish momentum. The 50-day EMA ($20.30) is acting as dynamic support, and the RSI (14) at 58 shows room for upward movement before reaching overbought levels (>70). A golden cross (50-day EMA crossing above 200-day EMA at $19.80) formed last week, reinforcing the bullish case. Price action is forming a bullish flag pattern, indicating a potential continuation to $24.00.
Trade Plan:
Entry: $21.90 (post-consolidation breakout confirmation above $21.85).
Stop Loss: $20.20 (below 50-day EMA).
Target: $24.00 (next resistance, ~9.8% upside).
Risk-Reward Ratio: 1:2.
Timeframe: 1-2 weeks.
Indicators: 50/200-day EMA, RSI, Volume.
Trade Plan:
Entry: $21.90 (post-consolidation breakout confirmation above $21.85).
Stop Loss: $20.20 (below 50-day EMA).
Target: $24.00 (next resistance, ~9.8% upside).
Risk-Reward Ratio: 1:2.
Timeframe: 1-2 weeks.
Indicators: 50/200-day EMA, RSI, Volume.
Disclaimer
The information and publications are not meant to be, and do not constitute, financial, investment, trading, or other types of advice or recommendations supplied or endorsed by TradingView. Read more in the Terms of Use.
Disclaimer
The information and publications are not meant to be, and do not constitute, financial, investment, trading, or other types of advice or recommendations supplied or endorsed by TradingView. Read more in the Terms of Use.