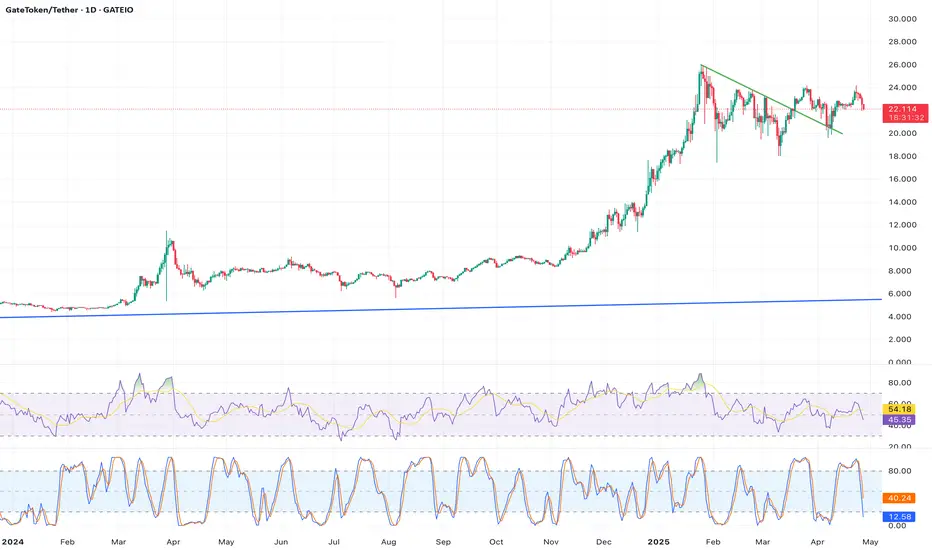
Analysis: The 14-day RSI for  GT is at 26.10, indicating oversold conditions (<30), which often precede short-term price reversals. The daily chart shows GT trading at $22.145, just above the key support level of $21.15. A Doji candlestick pattern formed in the last session, suggesting indecision and a potential bounce. The 20-day Exponential Moving Average (EMA) at $22.59 acts as immediate resistance, and a break above could confirm bullish momentum. Recent trading volume ($13.93M) remains healthy, supporting a potential recovery.
Price Target/Outlook:GT could rally to $23–$23.50 within 7–10 days if RSI climbs above 30. Place a stop-loss below $21.15 to manage downside risk.
Price Target/Outlook:
Disclaimer
The information and publications are not meant to be, and do not constitute, financial, investment, trading, or other types of advice or recommendations supplied or endorsed by TradingView. Read more in the Terms of Use.
Disclaimer
The information and publications are not meant to be, and do not constitute, financial, investment, trading, or other types of advice or recommendations supplied or endorsed by TradingView. Read more in the Terms of Use.