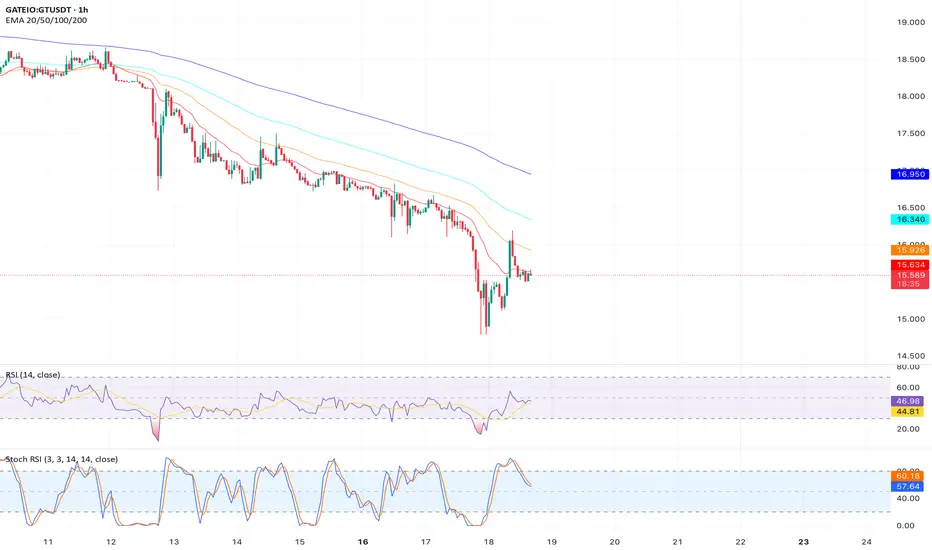
Analysis:  GT has broken below the 50-day SMA ($15.80) on the daily chart, confirming a bearish shift in market structure. The RSI at 45 is trending downward, and declining volume on rebounds suggests weak buying interest. A retest of the broken support at $15.30 failed, aligning with a bearish engulfing candle.
Key Levels:
Support: $14.50, $13.80
Resistance: $15.30 (former support), $16.00
Target: $13.80
Outlook: Short on a close below $15.30 with a stop loss above $15.80. Target $13.80 for a 10%+ decline. Monitor for continued selling pressure.
Key Levels:
Support: $14.50, $13.80
Resistance: $15.30 (former support), $16.00
Target: $13.80
Outlook: Short on a close below $15.30 with a stop loss above $15.80. Target $13.80 for a 10%+ decline. Monitor for continued selling pressure.
Disclaimer
The information and publications are not meant to be, and do not constitute, financial, investment, trading, or other types of advice or recommendations supplied or endorsed by TradingView. Read more in the Terms of Use.
Disclaimer
The information and publications are not meant to be, and do not constitute, financial, investment, trading, or other types of advice or recommendations supplied or endorsed by TradingView. Read more in the Terms of Use.