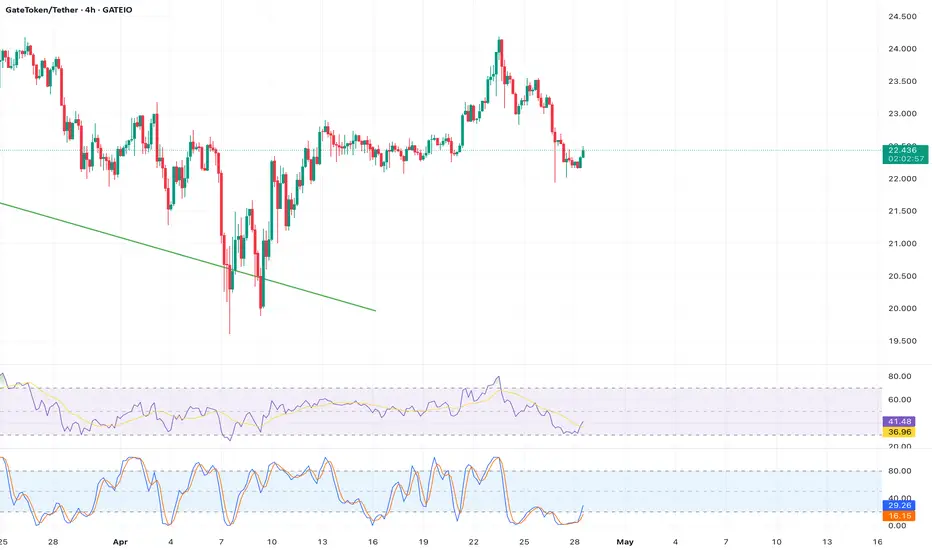
Analysis: Trading at $22.44,  GT is bullish on the 2-hour chart, with the price above the Parabolic SAR (buy signal) and the 20-period EMA ($22.30). The RSI (62) shows room for upside before overbought conditions. Resistance at $23.082 (R2) is the next hurdle, with a potential move to $23.50 if broken, aligning with Gate.io’s bullish momentum. Support at $22.214 (S1) offers a low-risk entry. Volume is steady, supporting the bullish case. Enter long above $23.082.
Indicators: Parabolic SAR (Buy), 20-period EMA (~$22.30), RSI (62), Resistance ($23.082), Support ($22.214).
Indicators: Parabolic SAR (Buy), 20-period EMA (~$22.30), RSI (62), Resistance ($23.082), Support ($22.214).
Disclaimer
The information and publications are not meant to be, and do not constitute, financial, investment, trading, or other types of advice or recommendations supplied or endorsed by TradingView. Read more in the Terms of Use.
Disclaimer
The information and publications are not meant to be, and do not constitute, financial, investment, trading, or other types of advice or recommendations supplied or endorsed by TradingView. Read more in the Terms of Use.