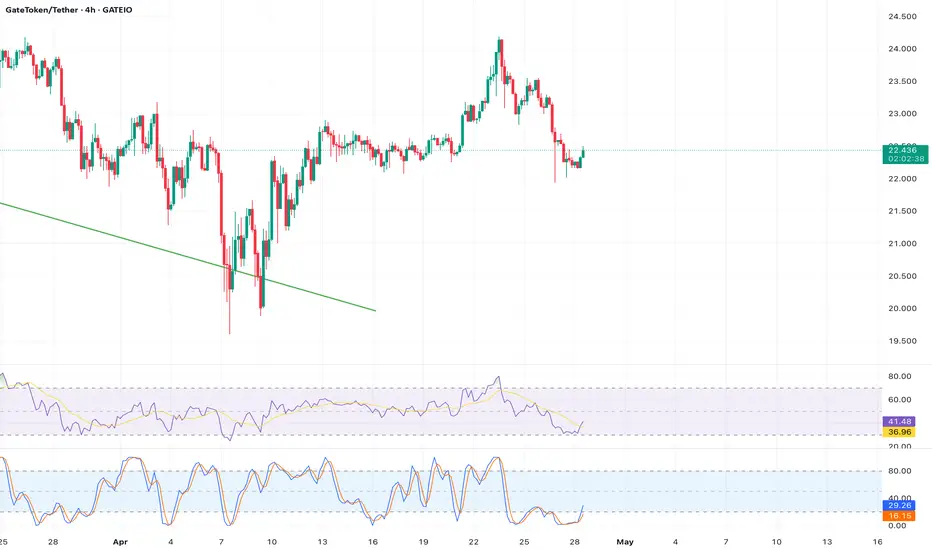
Analysis: At $22.44,  GT shows weakening momentum on the 1-hour chart, with declining OBV indicating reduced buying interest. The RSI (~44) is trending toward oversold, and the price is approaching support at $21.965 (S2). A break below $22.214 (S1) could target $21.965, as suggested by CoinCodex’s bearish outlook. X sentiment is cautious, with traders eyeing lower supports. Bears could short below $22.214, while bulls should wait for a volume spike to confirm a reversal.
Indicators: OBV (Declining), RSI (44), Support ($21.965, $22.214), Pivot Levels.
Indicators: OBV (Declining), RSI (44), Support ($21.965, $22.214), Pivot Levels.
Disclaimer
The information and publications are not meant to be, and do not constitute, financial, investment, trading, or other types of advice or recommendations supplied or endorsed by TradingView. Read more in the Terms of Use.
Disclaimer
The information and publications are not meant to be, and do not constitute, financial, investment, trading, or other types of advice or recommendations supplied or endorsed by TradingView. Read more in the Terms of Use.