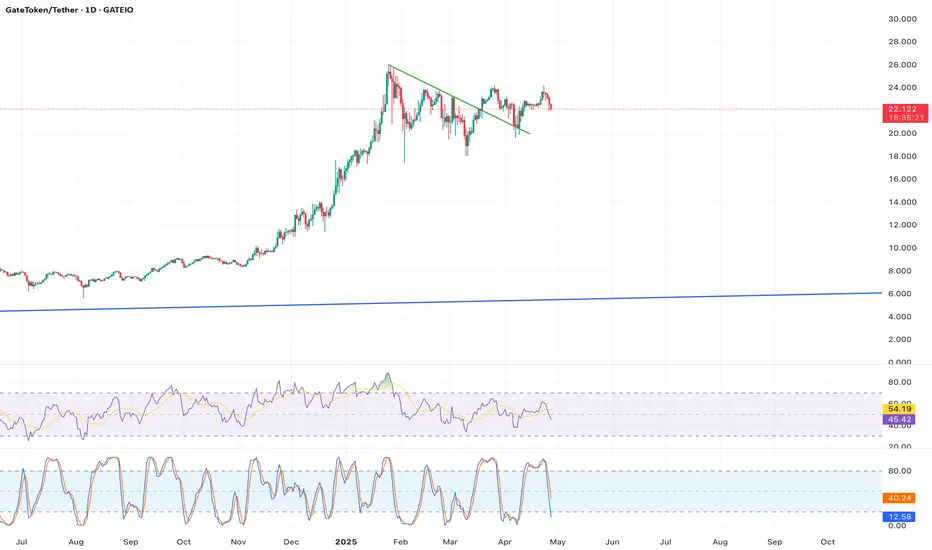
Description:  GT has recently broken above the $21.15 resistance level, a significant barrier identified in historical price action, and is now consolidating near $22.145. The breakout is supported by a surge in trading volume, indicating strong buyer interest. The 200-day Simple Moving Average (SMA) at approximately $11.38 (projected to rise) remains far below, suggesting a strong bullish trend. The Relative Strength Index (RSI) on the weekly chart is around 60, indicating room for further upside without being overbought. A golden cross (50-day SMA crossing above 200-day SMA) formed earlier in 2025, reinforcing the long-term bullish sentiment.
Key Indicators/Patterns: Breakout above resistance, high trading volume, 200-day SMA, RSI, golden cross.
Price Target: If the breakout holds,GT could target its all-time high of $25.94 by Q3 2025, with potential to reach $30-$35 by year-end if bullish market conditions persist.
Timeframe: 6-12 months.
Source Reference: (resistance at $21.15), (200-day SMA projection), (all-time high).
Key Indicators/Patterns: Breakout above resistance, high trading volume, 200-day SMA, RSI, golden cross.
Price Target: If the breakout holds,
Timeframe: 6-12 months.
Source Reference: (resistance at $21.15), (200-day SMA projection), (all-time high).
Disclaimer
The information and publications are not meant to be, and do not constitute, financial, investment, trading, or other types of advice or recommendations supplied or endorsed by TradingView. Read more in the Terms of Use.
Disclaimer
The information and publications are not meant to be, and do not constitute, financial, investment, trading, or other types of advice or recommendations supplied or endorsed by TradingView. Read more in the Terms of Use.