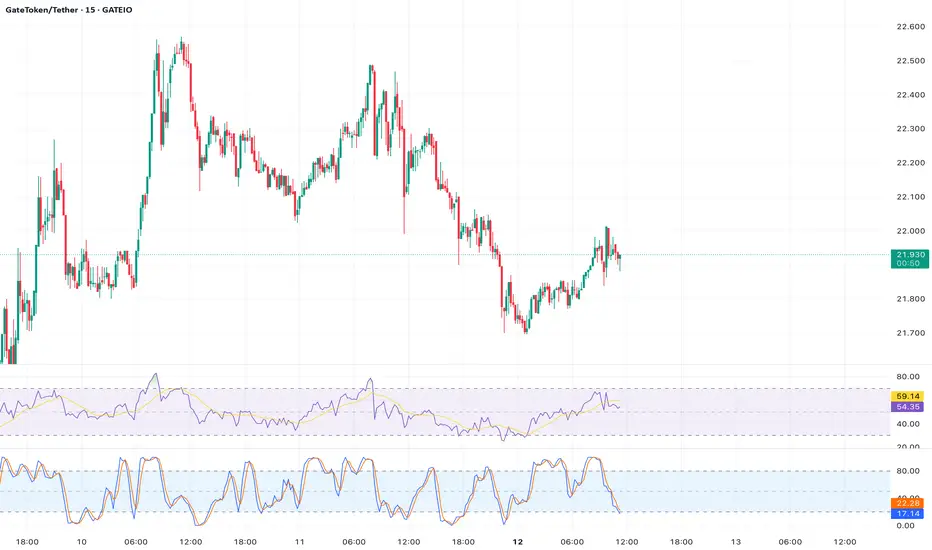
Analysis:  GT is trading at $21.67, with a bearish sentiment reflected by 16 out of 31 technical indicators signaling sell, compared to 15 bullish signals. The RSI at 49.36 is neutral, offering no strong reversal signal, and the price is struggling to break above the $22.67 resistance. The Stochastic Oscillator is in the overbought region (>80), suggesting potential for a pullback. A drop below the pivot point of $21.47 could see GT test the $19.95 support, with further downside to $18.74 if bearish momentum accelerates.
Entry Point: $21.50
Target Price: $19.95
Stop Loss: $22.80
Timeframe: 1–2 weeks
Rationale: The lack of bullish momentum, combined with overbought Stochastic and resistance at $22.67, supports a short-term bearish outlook, aligning with broader market caution.
Entry Point: $21.50
Target Price: $19.95
Stop Loss: $22.80
Timeframe: 1–2 weeks
Rationale: The lack of bullish momentum, combined with overbought Stochastic and resistance at $22.67, supports a short-term bearish outlook, aligning with broader market caution.
Disclaimer
The information and publications are not meant to be, and do not constitute, financial, investment, trading, or other types of advice or recommendations supplied or endorsed by TradingView. Read more in the Terms of Use.
Disclaimer
The information and publications are not meant to be, and do not constitute, financial, investment, trading, or other types of advice or recommendations supplied or endorsed by TradingView. Read more in the Terms of Use.