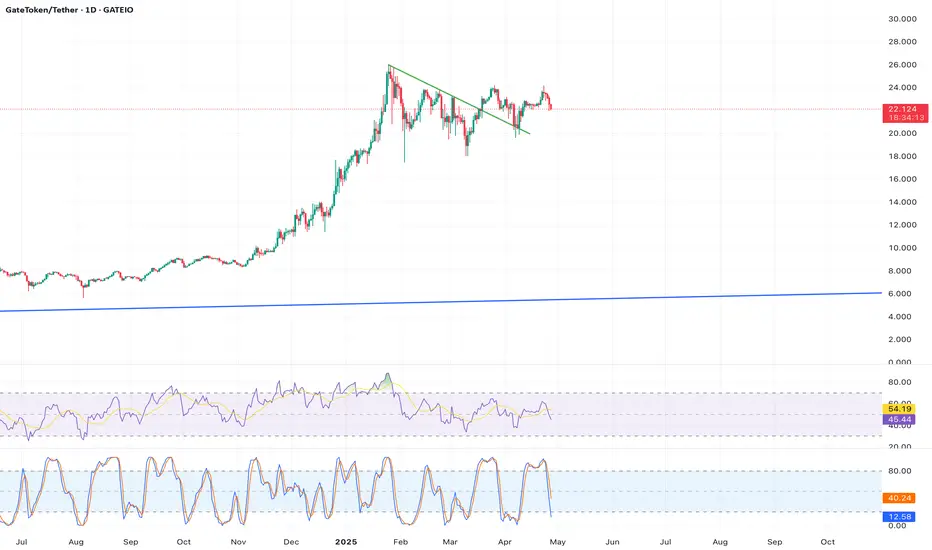
Description: Following a sharp rally from $20.77 (Bollinger Band lower band),  GT is forming a bullish flag pattern on the 1-hour chart. The flagpole was formed by a 7% surge, and the current price of $22.145 is within the flag’s consolidation phase. The Stochastic Oscillator shows a bullish crossover in the neutral zone, suggesting a breakout is imminent. A move above $22.50 could confirm the pattern.
Key Indicators/Patterns: Bullish flag, Bollinger Bands, Stochastic Oscillator.
Price Target: A breakout could pushGT to $23.50-$24.00 within 3-5 days.
Timeframe: 3-5 days.
Source Reference: (Bollinger Bands).
Key Indicators/Patterns: Bullish flag, Bollinger Bands, Stochastic Oscillator.
Price Target: A breakout could push
Timeframe: 3-5 days.
Source Reference: (Bollinger Bands).
Disclaimer
The information and publications are not meant to be, and do not constitute, financial, investment, trading, or other types of advice or recommendations supplied or endorsed by TradingView. Read more in the Terms of Use.
Disclaimer
The information and publications are not meant to be, and do not constitute, financial, investment, trading, or other types of advice or recommendations supplied or endorsed by TradingView. Read more in the Terms of Use.