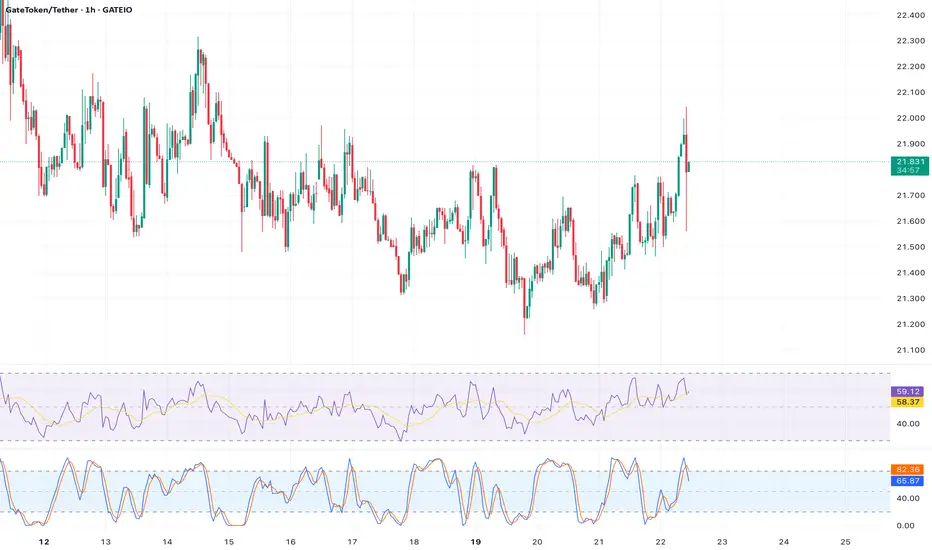
Analysis: At $21.8,  GT shows a bearish RSI divergence on the daily chart, with the price making higher highs while RSI forms lower highs. The price is above the upper Bollinger Band, a reversal signal. The weekly chart’s lower high and declining volume suggest a drop to $19.46, the weekly forecast low.
Entry: $21.80 - $22.00
Target: $19.46 (10.73% downside)
Stop Loss: $22.80 (4.59% upside)
Risk-Reward Ratio: 2.34:1
Indicators: RSI Divergence, Bollinger Bands, Volume
Entry: $21.80 - $22.00
Target: $19.46 (10.73% downside)
Stop Loss: $22.80 (4.59% upside)
Risk-Reward Ratio: 2.34:1
Indicators: RSI Divergence, Bollinger Bands, Volume
Disclaimer
The information and publications are not meant to be, and do not constitute, financial, investment, trading, or other types of advice or recommendations supplied or endorsed by TradingView. Read more in the Terms of Use.
Disclaimer
The information and publications are not meant to be, and do not constitute, financial, investment, trading, or other types of advice or recommendations supplied or endorsed by TradingView. Read more in the Terms of Use.