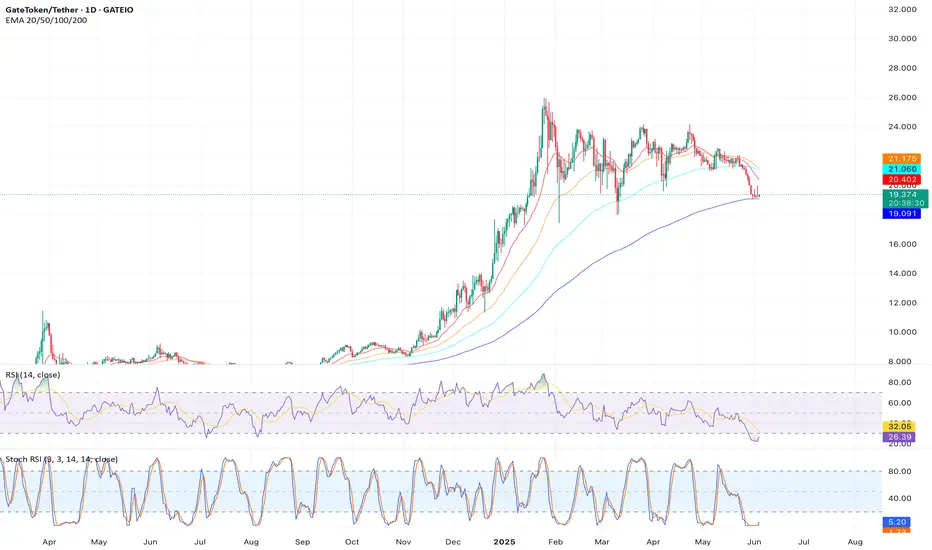
Analysis: At $19.37, GT is forming a bullish rectangle pattern on the daily chart, with support at $19.55 and resistance at $21.15. The price is above the 50-day SMA ($21.37), indicating short-term bullishness. The 14-day RSI at 26.10 suggests oversold conditions, hinting at a potential reversal. A breakout above $21.15 could push GT toward $25, supported by Gate.io’s ecosystem growth and deflationary token burns.
Outlook: Long position on a breakout above $21.15, targeting $25. Place a stop-loss below $19.55 to manage risk. Monitor RSI for confirmation of momentum.
Outlook: Long position on a breakout above $21.15, targeting $25. Place a stop-loss below $19.55 to manage risk. Monitor RSI for confirmation of momentum.
Disclaimer
The information and publications are not meant to be, and do not constitute, financial, investment, trading, or other types of advice or recommendations supplied or endorsed by TradingView. Read more in the Terms of Use.
Disclaimer
The information and publications are not meant to be, and do not constitute, financial, investment, trading, or other types of advice or recommendations supplied or endorsed by TradingView. Read more in the Terms of Use.