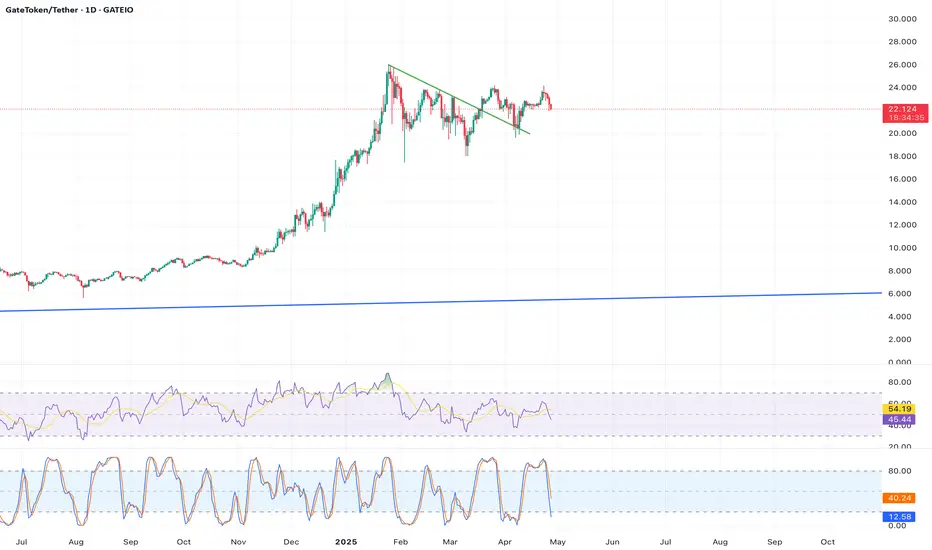
Description: On the 4-hour chart,  GT has formed an inverse head and shoulders pattern, with the neckline at $22.00 already broken, as noted in recent market sentiment on X. The price is consolidating above this level at $22.145, supported by a rising 50-period SMA. The RSI on the 4-hour chart is at 55, indicating neutral momentum with room for growth. Volume spikes during the breakout confirm buyer conviction.
Key Indicators/Patterns: Inverse head and shoulders, 50-period SMA, RSI, volume spike.
Price Target:GT could reach $24 within 1-2 weeks if consolidation holds above $22.00.
Timeframe: 7-14 days.
Source Reference: (inverse head and shoulders analysis).
Key Indicators/Patterns: Inverse head and shoulders, 50-period SMA, RSI, volume spike.
Price Target:
Timeframe: 7-14 days.
Source Reference: (inverse head and shoulders analysis).
Disclaimer
The information and publications are not meant to be, and do not constitute, financial, investment, trading, or other types of advice or recommendations supplied or endorsed by TradingView. Read more in the Terms of Use.
Disclaimer
The information and publications are not meant to be, and do not constitute, financial, investment, trading, or other types of advice or recommendations supplied or endorsed by TradingView. Read more in the Terms of Use.