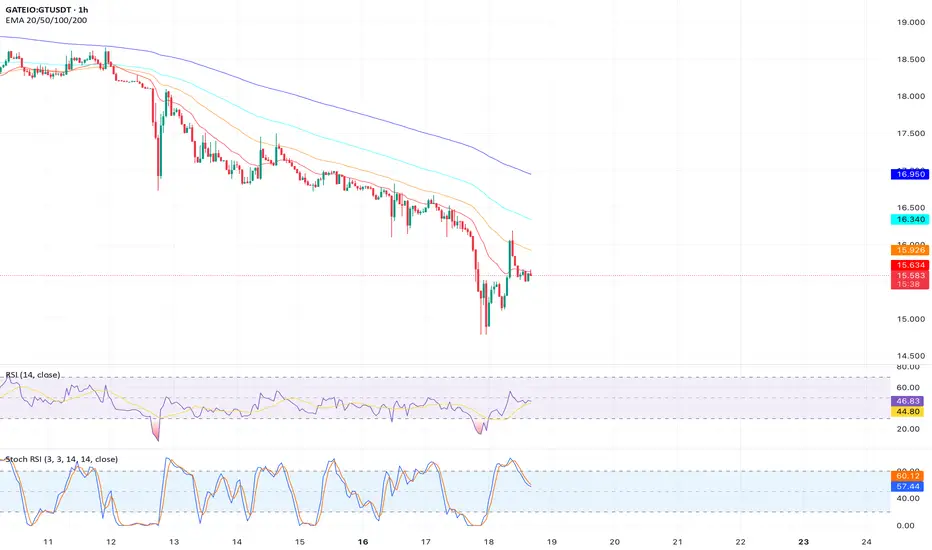
Analysis:  GT has broken below the 200-day EMA ($15.50) on the daily chart, a significant bearish signal. The price is forming a bearish flag pattern, with the RSI at 42 trending downward. Recent posts on X highlight GT’s weak market structure, supporting a bearish bias.
Key Levels:
Support: $14.50, $14.00
Resistance: $15.50, $16.00
Target: $14.00
Outlook: Short on a close below $15.50 with a stop loss above $15.80. Target $14.00 for a 10% drop. Monitor for flag breakdown confirmation.
Key Levels:
Support: $14.50, $14.00
Resistance: $15.50, $16.00
Target: $14.00
Outlook: Short on a close below $15.50 with a stop loss above $15.80. Target $14.00 for a 10% drop. Monitor for flag breakdown confirmation.
Disclaimer
The information and publications are not meant to be, and do not constitute, financial, investment, trading, or other types of advice or recommendations supplied or endorsed by TradingView. Read more in the Terms of Use.
Disclaimer
The information and publications are not meant to be, and do not constitute, financial, investment, trading, or other types of advice or recommendations supplied or endorsed by TradingView. Read more in the Terms of Use.