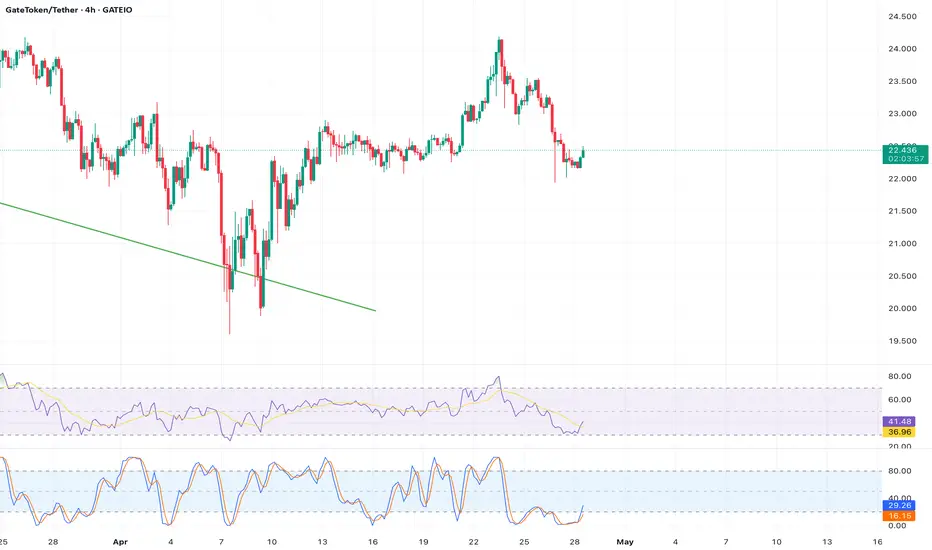
Analysis:  GT at $22.44 is forming a bullish wedge on the 2-hour chart, with resistance at $23.082 (R2). The price is above the 50-period SMA ($22.20), and the ADX (27) indicates a strengthening trend. X posts note increased buying interest after GT broke 22.5 USDT on Gate.io. A breakout above $23.082 could target $23.50, aligning with WalletInvestor’s 14-day forecast of $23.709. Support at $22.214 (S1) provides a low-risk entry. Long positions are favored on a close above $23.082.
Indicators: Bullish Wedge, 50-period SMA (~$22.20), ADX (27), Resistance ($23.082), Support ($22.214).
Indicators: Bullish Wedge, 50-period SMA (~$22.20), ADX (27), Resistance ($23.082), Support ($22.214).
Disclaimer
The information and publications are not meant to be, and do not constitute, financial, investment, trading, or other types of advice or recommendations supplied or endorsed by TradingView. Read more in the Terms of Use.
Disclaimer
The information and publications are not meant to be, and do not constitute, financial, investment, trading, or other types of advice or recommendations supplied or endorsed by TradingView. Read more in the Terms of Use.