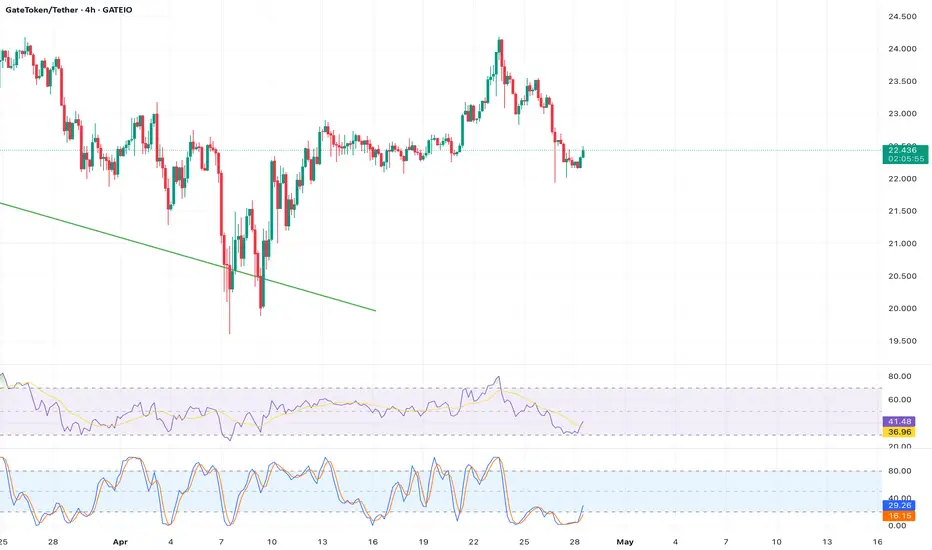
Analysis:  GT at $22.44 is testing the pivot resistance at $22.773 (R1) on the 4-hour chart. Recent X posts highlight a bullish pennant forming, with the price holding above the 50-period SMA ($22.20). The RSI (14-day) is at 58, showing moderate bullish momentum. A close above $22.773 could target $24.50, supported by Gate.io’s recent price action breaking 22.5 USDT. Volume is rising slightly, signaling potential breakout confirmation. Support at $22.214 (S1) offers a tight stop-loss. Traders should enter long on a breakout with a target of $24.50.
Indicators: Bullish Pennant, 50-period SMA ($22.20), RSI (58), Resistance ($22.773), Support ($22.214), Target ($24.50).
Indicators: Bullish Pennant, 50-period SMA ($22.20), RSI (58), Resistance ($22.773), Support ($22.214), Target ($24.50).
Disclaimer
The information and publications are not meant to be, and do not constitute, financial, investment, trading, or other types of advice or recommendations supplied or endorsed by TradingView. Read more in the Terms of Use.
Disclaimer
The information and publications are not meant to be, and do not constitute, financial, investment, trading, or other types of advice or recommendations supplied or endorsed by TradingView. Read more in the Terms of Use.