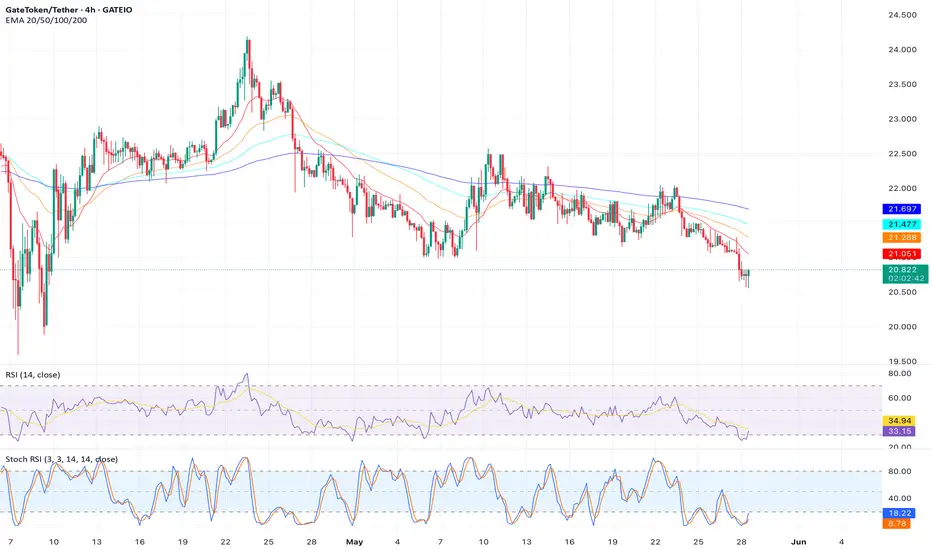
A bearish divergence on the 4-hour chart shows  GT’s price at $20.8 making higher lows while RSI forms lower highs, indicating weakening momentum. The price is near the $20.90 support, with a risk of falling to $20.73 if selling pressure persists. Short-term sentiment remains 50% bullish, 50% bearish.
Key Levels: Support at $20.73, resistance at $21.15.
Indicators: Bearish RSI divergence, neutral sentiment.
Outlook: Bearish; monitor for support break.
Key Levels: Support at $20.73, resistance at $21.15.
Indicators: Bearish RSI divergence, neutral sentiment.
Outlook: Bearish; monitor for support break.
Disclaimer
The information and publications are not meant to be, and do not constitute, financial, investment, trading, or other types of advice or recommendations supplied or endorsed by TradingView. Read more in the Terms of Use.
Disclaimer
The information and publications are not meant to be, and do not constitute, financial, investment, trading, or other types of advice or recommendations supplied or endorsed by TradingView. Read more in the Terms of Use.