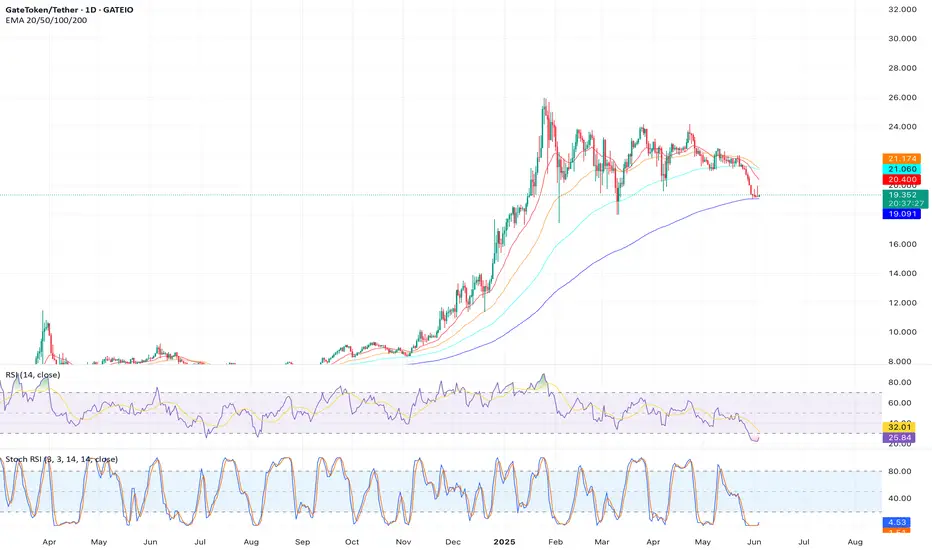
Analysis: At $19.37, GT exhibits bearish divergence on the 1-hour chart, with RSI declining while price attempts to hold support at $19.55. The 50-day SMA ($21.37) is acting as resistance, and low trading volume suggests waning buyer interest. A break below $19.15 could accelerate selling toward $17.72.
Outlook: Short on a close below $19.15, targeting $17.72, with a stop-loss above $19.55.
Outlook: Short on a close below $19.15, targeting $17.72, with a stop-loss above $19.55.
Disclaimer
The information and publications are not meant to be, and do not constitute, financial, investment, trading, or other types of advice or recommendations supplied or endorsed by TradingView. Read more in the Terms of Use.
Disclaimer
The information and publications are not meant to be, and do not constitute, financial, investment, trading, or other types of advice or recommendations supplied or endorsed by TradingView. Read more in the Terms of Use.