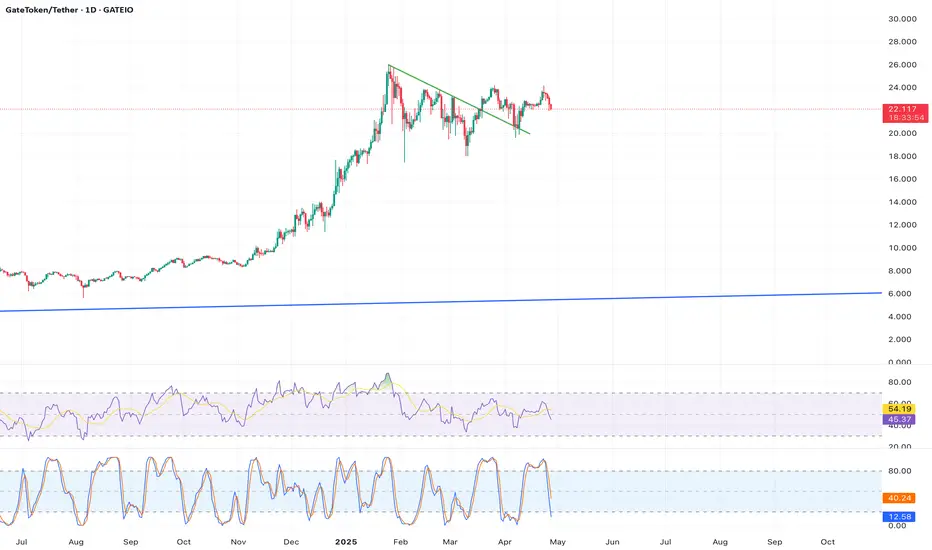
Description: The daily RSI for  GT recently dipped to 26.10, indicating oversold conditions, followed by a price bounce to $22.145. This reversal is supported by a hammer candlestick pattern at the $20.77 support level (lower Bollinger Band). The price is now testing the 50-day SMA at $18.44, with potential to reclaim the 20-day SMA at $22.59. A close above $22.59 would confirm bullish momentum.
Key Indicators/Patterns: RSI oversold, hammer candlestick, 50-day SMA, 20-day SMA.
Price Target:GT could rally to $23.00-$23.50 within 5-7 days if it breaks above $22.59.
Timeframe: 5-7 days.
Source Reference: (RSI at 26.10, Bollinger Bands), (50-day SMA).
Key Indicators/Patterns: RSI oversold, hammer candlestick, 50-day SMA, 20-day SMA.
Price Target:
Timeframe: 5-7 days.
Source Reference: (RSI at 26.10, Bollinger Bands), (50-day SMA).
Disclaimer
The information and publications are not meant to be, and do not constitute, financial, investment, trading, or other types of advice or recommendations supplied or endorsed by TradingView. Read more in the Terms of Use.
Disclaimer
The information and publications are not meant to be, and do not constitute, financial, investment, trading, or other types of advice or recommendations supplied or endorsed by TradingView. Read more in the Terms of Use.