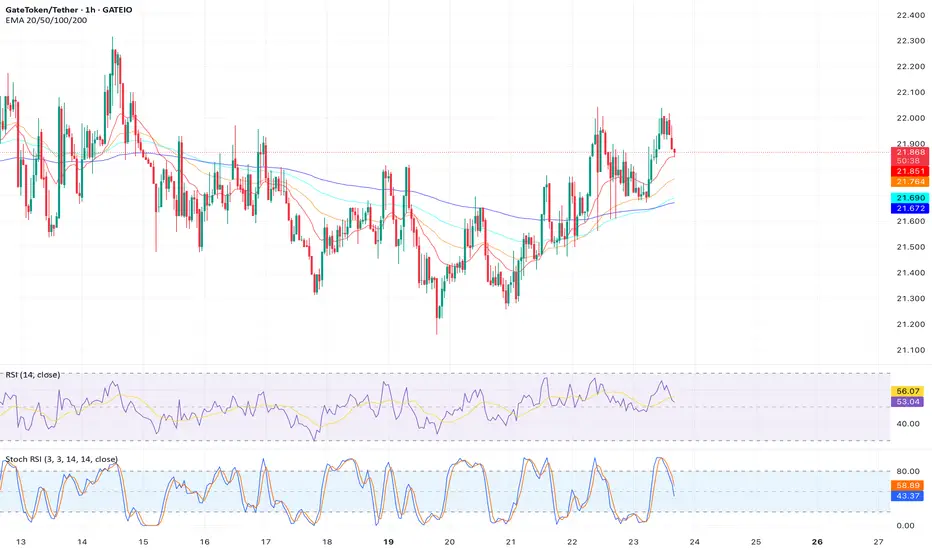
Analysis: A bearish engulfing candle formed on the daily chart at $22.00, indicating strong selling pressure. The stock is trading above the upper Bollinger Band ($21.90), suggesting overextension. The MACD histogram is flattening, hinting at weakening bullish momentum. A move below $21.50 could target the 50-day EMA at $20.30.
Trade Plan:
Entry: $21.60 (below engulfing candle low).
Stop Loss: $22.10 (above engulfing candle high).
Target: $20.30 (50-day EMA, ~7.1% downside).
Risk-Reward Ratio: 1:1.7.
Timeframe: 3-5 days.
Indicators: Bollinger Bands, MACD, Candlestick Patterns.
Trade Plan:
Entry: $21.60 (below engulfing candle low).
Stop Loss: $22.10 (above engulfing candle high).
Target: $20.30 (50-day EMA, ~7.1% downside).
Risk-Reward Ratio: 1:1.7.
Timeframe: 3-5 days.
Indicators: Bollinger Bands, MACD, Candlestick Patterns.
Disclaimer
The information and publications are not meant to be, and do not constitute, financial, investment, trading, or other types of advice or recommendations supplied or endorsed by TradingView. Read more in the Terms of Use.
Disclaimer
The information and publications are not meant to be, and do not constitute, financial, investment, trading, or other types of advice or recommendations supplied or endorsed by TradingView. Read more in the Terms of Use.