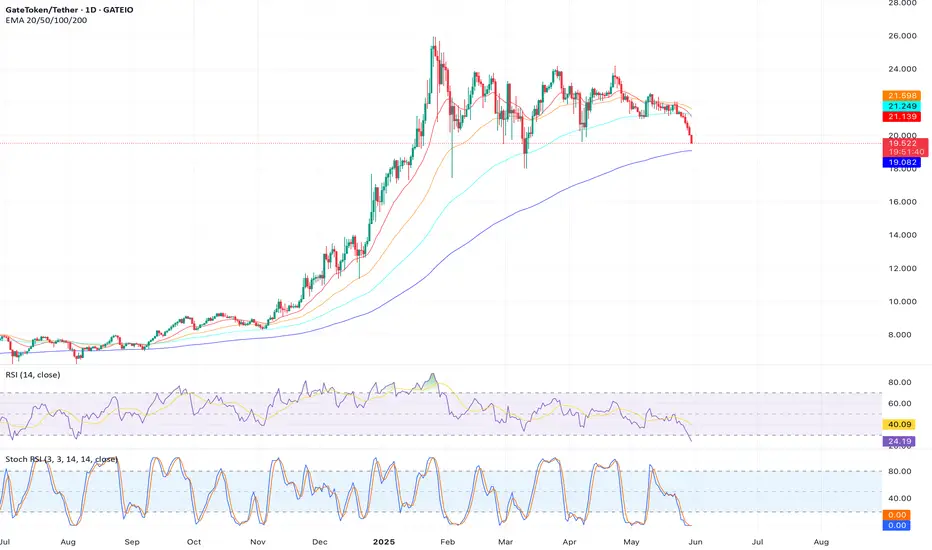
Analysis: GT is forming lower highs on the weekly chart, with declining trading volume signaling reduced interest. The price is below the Bollinger Bands’ SMA ($22.59), and a drop below $19.55 could target $18.00. The bearish sentiment is reinforced by 17/31 technical indicators signaling sell.
Trade Idea: Short at $19.50, targeting $18.00. Stop loss at $20.73 (pivot point).
Risk: A close above $21.15 could invalidate the bearish setup.
Trade Idea: Short at $19.50, targeting $18.00. Stop loss at $20.73 (pivot point).
Risk: A close above $21.15 could invalidate the bearish setup.
Disclaimer
The information and publications are not meant to be, and do not constitute, financial, investment, trading, or other types of advice or recommendations supplied or endorsed by TradingView. Read more in the Terms of Use.
Disclaimer
The information and publications are not meant to be, and do not constitute, financial, investment, trading, or other types of advice or recommendations supplied or endorsed by TradingView. Read more in the Terms of Use.