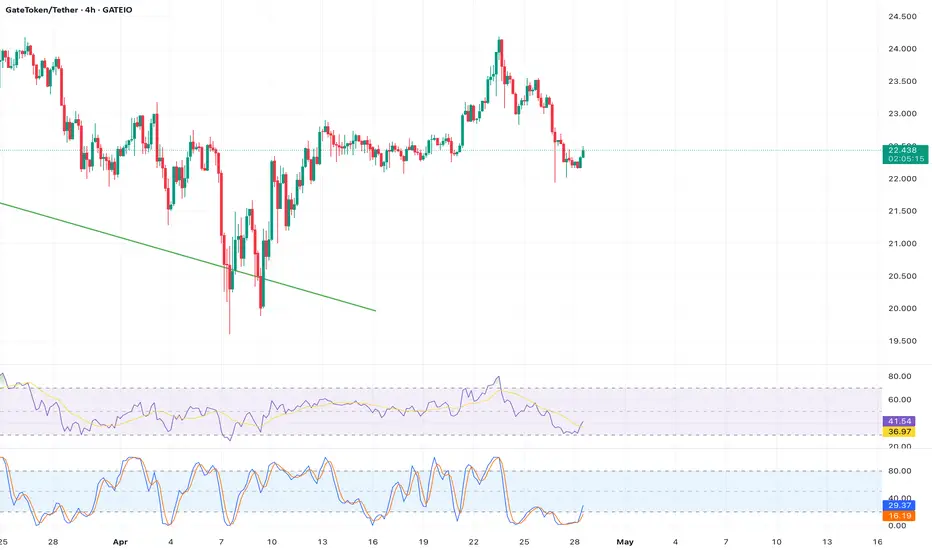
Analysis: At $22.44,  GT is hovering below the 20-period EMA ($22.50) on the 1-hour chart, signaling weakening short-term momentum. The MACD is showing a bearish divergence, with the signal line trending downward. The RSI (47) is approaching oversold territory, suggesting a potential drop to $22.10, near the lower Bollinger Band ($20.80). Recent X sentiment is mixed, with some traders eyeing a bounce, but volume is declining. Support at $22.214 (S1) may be tested. Scalpers could short with a stop above $22.67.
Indicators: 20-period EMA ($22.50), MACD (Bearish Divergence), RSI (47), Bollinger Bands (~$20.80–$24.50), Support ($22.10).
Indicators: 20-period EMA ($22.50), MACD (Bearish Divergence), RSI (47), Bollinger Bands (~$20.80–$24.50), Support ($22.10).
Disclaimer
The information and publications are not meant to be, and do not constitute, financial, investment, trading, or other types of advice or recommendations supplied or endorsed by TradingView. Read more in the Terms of Use.
Disclaimer
The information and publications are not meant to be, and do not constitute, financial, investment, trading, or other types of advice or recommendations supplied or endorsed by TradingView. Read more in the Terms of Use.