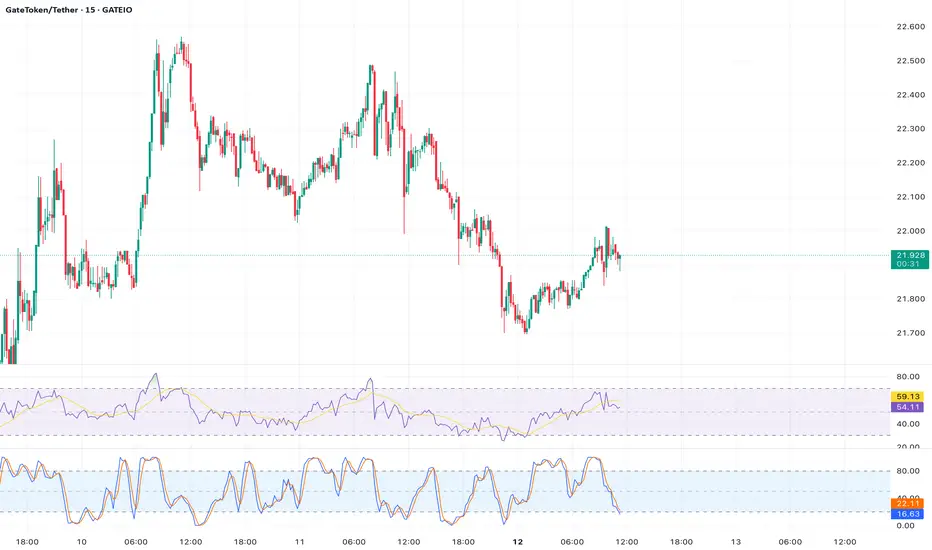
Analysis:  GT formed a double top pattern near $24.19, its cycle high, indicating strong resistance and potential exhaustion of bullish momentum. The price has since declined, trading below the 20-day Exponential Moving Average (EMA) at $22.15, a bearish signal. The MACD line is crossing below the signal line, confirming weakening momentum. If GT fails to reclaim $22.15, it could slide toward the $19.95 support, with a deeper correction to $18.74 possible.
Entry Point: $21.90
Target Price: $19.95
Stop Loss: $22.50
Timeframe: 2–3 weeks
Rationale: The double top and bearish MACD crossover suggestGT is poised for a correction, especially after failing to sustain gains above recent highs.
Entry Point: $21.90
Target Price: $19.95
Stop Loss: $22.50
Timeframe: 2–3 weeks
Rationale: The double top and bearish MACD crossover suggest
Disclaimer
The information and publications are not meant to be, and do not constitute, financial, investment, trading, or other types of advice or recommendations supplied or endorsed by TradingView. Read more in the Terms of Use.
Disclaimer
The information and publications are not meant to be, and do not constitute, financial, investment, trading, or other types of advice or recommendations supplied or endorsed by TradingView. Read more in the Terms of Use.