Analysis:  GT is trading near a descending trendline resistance at $22.20, which has capped upside since early 2024. The RSI (14) at 64 suggests overbought conditions, and stochastic oscillators show a bearish crossover in the overbought zone. Volume is declining on recent upticks, indicating weak buying pressure. A break below $21.50 could target the 200-day EMA at $19.80.
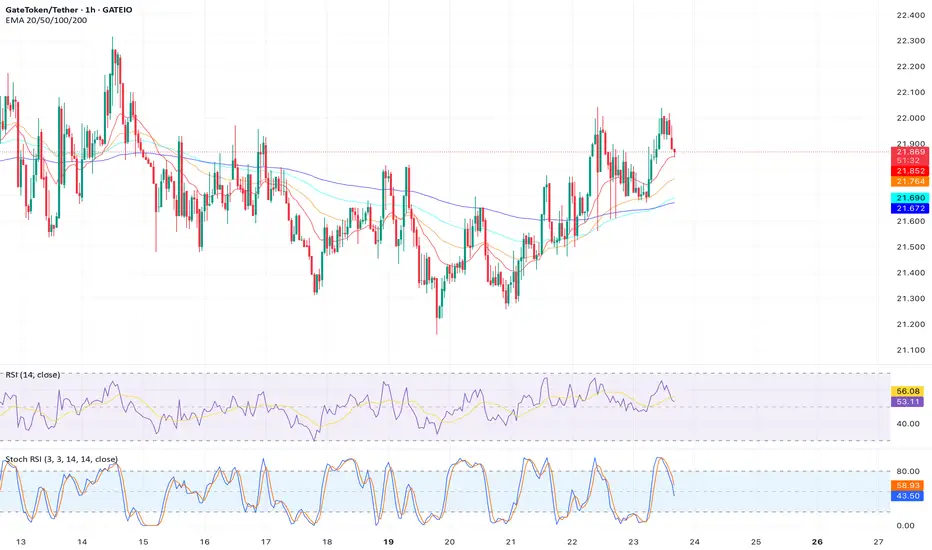
Trade Plan:
Entry: $21.60 (below current price after trendline rejection).
Stop Loss: $22.30 (above trendline).
Target: $19.80 (200-day EMA, ~9.2% downside).
Risk-Reward Ratio: 1:1.8.
Timeframe: 1-2 weeks.
Indicators: RSI, Stochastic, 200-day EMA.
Trade Plan:
Entry: $21.60 (below current price after trendline rejection).
Stop Loss: $22.30 (above trendline).
Target: $19.80 (200-day EMA, ~9.2% downside).
Risk-Reward Ratio: 1:1.8.
Timeframe: 1-2 weeks.
Indicators: RSI, Stochastic, 200-day EMA.
Disclaimer
The information and publications are not meant to be, and do not constitute, financial, investment, trading, or other types of advice or recommendations supplied or endorsed by TradingView. Read more in the Terms of Use.
Disclaimer
The information and publications are not meant to be, and do not constitute, financial, investment, trading, or other types of advice or recommendations supplied or endorsed by TradingView. Read more in the Terms of Use.