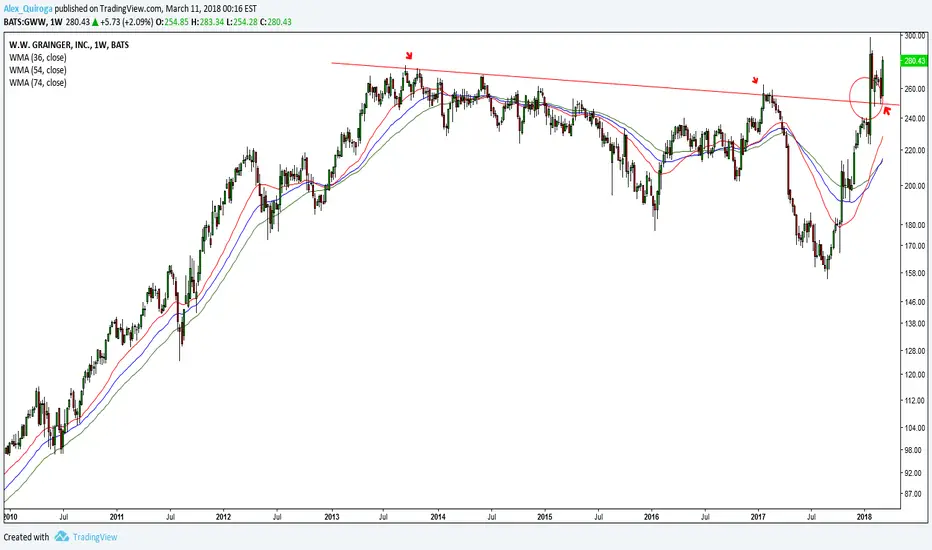
I give importance to two things
* First: Weekly Charts
* Second: the years that it took the price to broke the resistance (4 Years and 6 months)
And to this I add the way that the price broke the resistance line (an overnight Gap)
Not visible from the weekly chart but represented by a big green candle (red circle)
This idea meets this requirements:
Resistance breakout + price pullback or retracement + swing low + resistance now becomes support
Deliberate practice eliminate overthink
Not spend too much time watching the same chart and rationalizing as an engineer
because there is no math to get you out of having to experience uncertainty
Train your eyes
Disclaimer
The information and publications are not meant to be, and do not constitute, financial, investment, trading, or other types of advice or recommendations supplied or endorsed by TradingView. Read more in the Terms of Use.
Disclaimer
The information and publications are not meant to be, and do not constitute, financial, investment, trading, or other types of advice or recommendations supplied or endorsed by TradingView. Read more in the Terms of Use.