Short
$GXY End current secondary trend (blue) in Primary trend (Green)
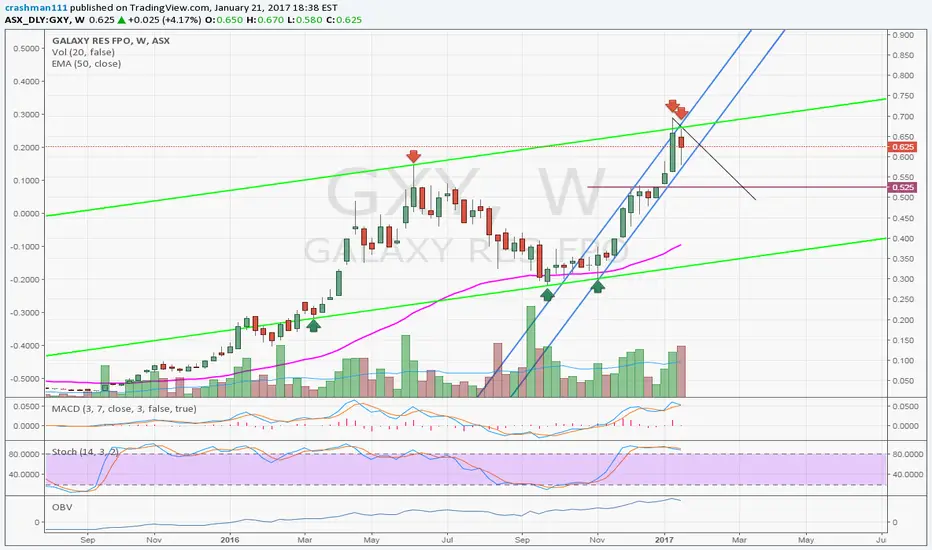
Weekly view and drew the bottom support trend line with 3 connecting points.
>>> cloned the line and placed it on top of the last confirmed high.
= we had a fakeout 2 weeks ago on the weekly and last week touched the same point.
It all just lined itself up.
The indicators also appear to be reversing on weekly and more confirming on daily view.
Pink line is 50day EMA which appears to be a dynamic support.
Structural support at 52.5c
Disclaimer
The information and publications are not meant to be, and do not constitute, financial, investment, trading, or other types of advice or recommendations supplied or endorsed by TradingView. Read more in the Terms of Use.
Disclaimer
The information and publications are not meant to be, and do not constitute, financial, investment, trading, or other types of advice or recommendations supplied or endorsed by TradingView. Read more in the Terms of Use.