Short
$GXY getting hammered
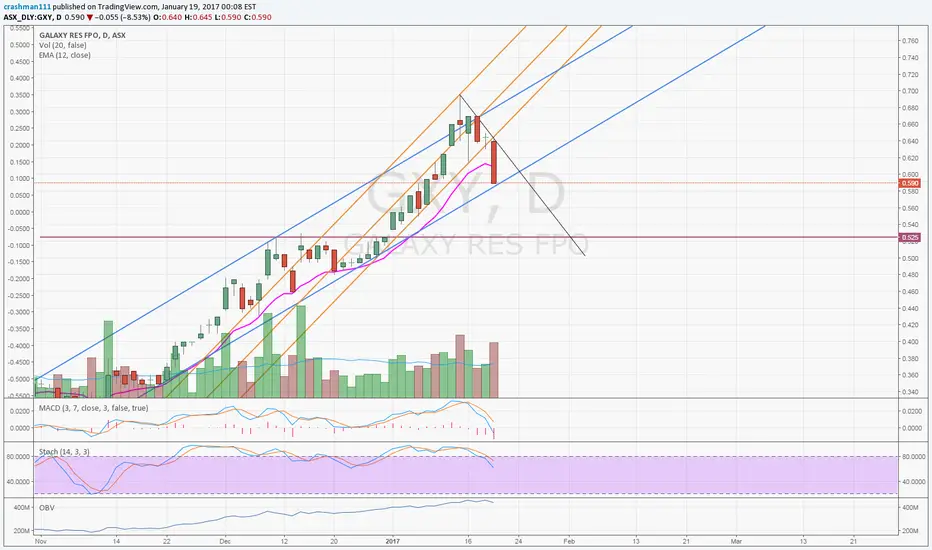
Doji rejected and price broke the 10 day EMA that was holding the price up. Price also broke through secondary trend in orange. technicals looking negative and pointing to a continuation to the downside following the large red candle. next support at 52.5c
Note
Heiken Ashi bars are bearish. MACD (3.7.3) is bearish. Stochastics pointing down. Today's 20/1/17 candle, although green, is not reliable enough to decide about bullishness, since it reflects only one day’s trading that was under buyers’ control. It may show the continuation of a trend as well as the reversal. Other neighboring candlesticks must be taken into consideration for a decision regarding market direction. Must wait for next trading day to decide direction of trend either up through the black line or down to the blue line. If the price goes down the next support level likely to be seen is 52.5c. If we go up 70c looks likely.
Disclaimer
The information and publications are not meant to be, and do not constitute, financial, investment, trading, or other types of advice or recommendations supplied or endorsed by TradingView. Read more in the Terms of Use.
Disclaimer
The information and publications are not meant to be, and do not constitute, financial, investment, trading, or other types of advice or recommendations supplied or endorsed by TradingView. Read more in the Terms of Use.