Fundamental Backdrop
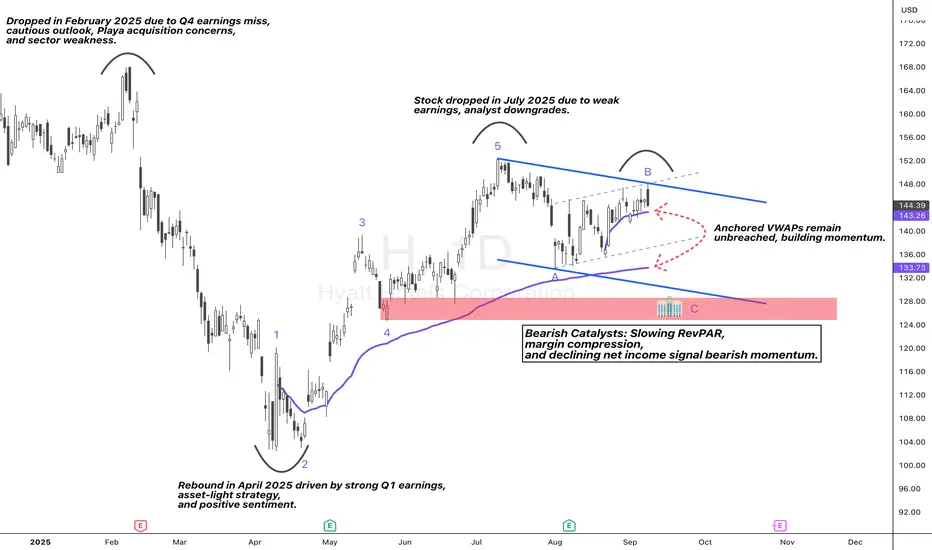
Hyatt’s stock has seen significant volatility recently, driven by a mix of macroeconomic factors and company-specific challenges. In February 2025, the stock dropped due to a Q4 earnings miss, a cautious 2025 outlook, and concerns around the Playa acquisition. However, it rebounded in April 2025, driven by strong Q1 earnings, a successful asset-light strategy, and positive market sentiment.
5-Wave Uptrend and Correction
From this rebound, a 5-wave uptrend formed, pushing the stock nearly 50% higher before correcting into wave A and B. This correction was primarily due to weak earnings and analyst downgrades in July 2025, which triggered a drop in stock price.
Anticipating Wave C
Now, we are anticipating wave C based on several bearish catalysts: slowing RevPAR growth, margin compression, and declining net income, all signaling potential bearish momentum. The stock is building momentum and could break lower if it breaches the anchored VWAPs. While the VWAP anchored to April could provide short-term support, a break of this level could unlock further downside momentum. We are eyeing $128 as a key support area.
Volume Footprint and Divergence

Additionally, the volume footprint at the top of wave B is showing divergence. As the price climbs to the upper bound of the ascending channel, there is a notable bearish delta in the volume print, suggesting weakening momentum at these levels. This signals a potential bearish setup if the stock fails to sustain these gains.
Bearish Setup
Overall, the market is closely watching for a break of the VWAPs, which could trigger further downside toward the support zone at $128.
Hyatt’s stock has seen significant volatility recently, driven by a mix of macroeconomic factors and company-specific challenges. In February 2025, the stock dropped due to a Q4 earnings miss, a cautious 2025 outlook, and concerns around the Playa acquisition. However, it rebounded in April 2025, driven by strong Q1 earnings, a successful asset-light strategy, and positive market sentiment.
5-Wave Uptrend and Correction
From this rebound, a 5-wave uptrend formed, pushing the stock nearly 50% higher before correcting into wave A and B. This correction was primarily due to weak earnings and analyst downgrades in July 2025, which triggered a drop in stock price.
Anticipating Wave C
Now, we are anticipating wave C based on several bearish catalysts: slowing RevPAR growth, margin compression, and declining net income, all signaling potential bearish momentum. The stock is building momentum and could break lower if it breaches the anchored VWAPs. While the VWAP anchored to April could provide short-term support, a break of this level could unlock further downside momentum. We are eyeing $128 as a key support area.
Volume Footprint and Divergence
Additionally, the volume footprint at the top of wave B is showing divergence. As the price climbs to the upper bound of the ascending channel, there is a notable bearish delta in the volume print, suggesting weakening momentum at these levels. This signals a potential bearish setup if the stock fails to sustain these gains.
Bearish Setup
Overall, the market is closely watching for a break of the VWAPs, which could trigger further downside toward the support zone at $128.
Note
Price has opened and is holding below the most recent anchored VWAP, showing early signs of bearish momentum. However, we need to see how the stock behaves over the next few days to weeks to confirm whether this momentum will continue or reverse.Disclaimer
The information and publications are not meant to be, and do not constitute, financial, investment, trading, or other types of advice or recommendations supplied or endorsed by TradingView. Read more in the Terms of Use.
Disclaimer
The information and publications are not meant to be, and do not constitute, financial, investment, trading, or other types of advice or recommendations supplied or endorsed by TradingView. Read more in the Terms of Use.