Hawaiian Airlines HA Reversal Long
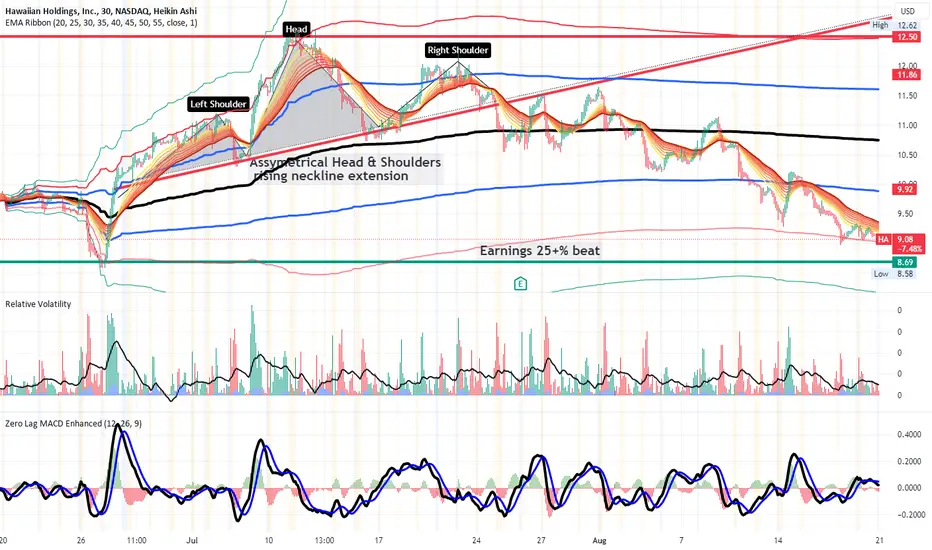
HA is on a 30 minute- chart. A Head and Shoulder pattern is drawn. It is assymetrical with
an ascending neckline extension. An anchored VWAP is added. Price is currently in the
deeply oversold zone near to the -2 standard aWVAP line. I see buyers and money flow
coming in at this level. The stop loss is 9. The first target is at 10.7 and so about 15% upside
in the area of the mean VWAP. The second target is the confluence of the July 10 pivot ,
the ascending neckline of the pattern and 2 deviations above aVWAP ( the thinnest red
line) at the area 12.5. This is about 35% upside. I will take this swing long trade and
investigate a suitable call option as well.
Disclaimer
The information and publications are not meant to be, and do not constitute, financial, investment, trading, or other types of advice or recommendations supplied or endorsed by TradingView. Read more in the Terms of Use.
Disclaimer
The information and publications are not meant to be, and do not constitute, financial, investment, trading, or other types of advice or recommendations supplied or endorsed by TradingView. Read more in the Terms of Use.