Hello Friends,
Welcome to RK_Chaarts,
Today we're going Analyze the chart of " HASBRO. " to identify a trend change opportunity.(Educational Post).
Let's get started!
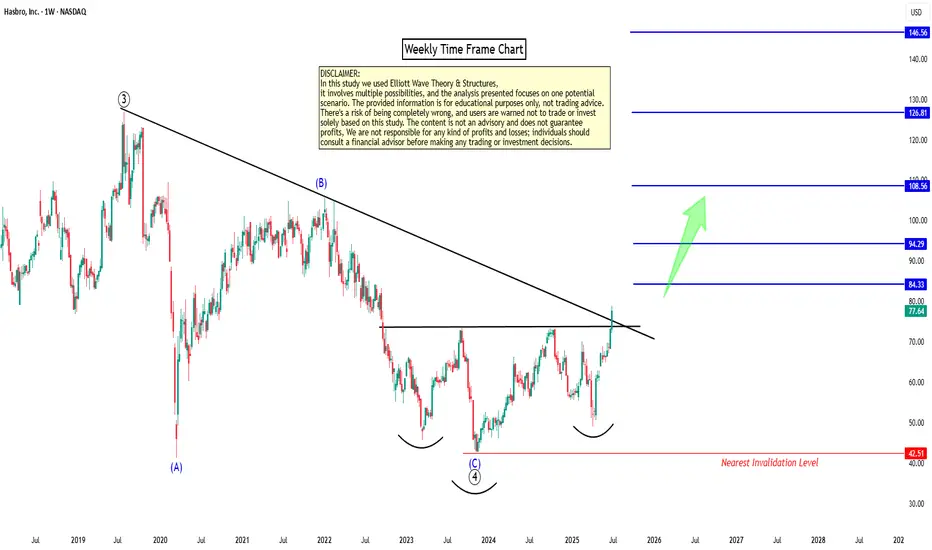
Today, we analyzed the weekly chart of "HASBRO" using Elliott Waves theory and chart patterns. We clearly observed that the July 2019 top, with a high of 126.87, completed a primary degree Wave ((3)) in Black. The recent bottom in November 2023, around 42.69, marked the end of primary degree Wave ((4)) in Black. Since then, the price has formed a higher high and low, indicating a potential reversal.
The recent weekly candle close has broken out of the Resistance trendline and also confirmed an inverted head and shoulders breakout along with good breakout in RSI on weekly-cum-monthly time frames. This suggests that we may be unfolding a primary degree Wave ((5)) in Black, which should consist of five sub-divisions of Intermidiete degree in Blue. Based on the chart, it appears that Intermidiete degree Waves (1) and (2) in Blue are complete, and Wave (3) may have started.
Resistance Trendline Breakout with Inverted Head n Shoulder Breakout

RSI Breakout on Weekly

RSI Breakout on Monthly

Major EMAs Support on Daily, Weekly & Monthly

Both Elliott Wave theory, EMAs support, Trendline Breakout and chart pattern Breakout indicates that the price is likely to move higher from here. However, please note that technical analysis is a game of probabilities, and there's always a chance of being wrong.
To mitigate this risk, we've marked an invalidation level around 42.69. If this level is breached, our analysis would be invalidated.
Projecting the target for Wave ((5)) using the 123.6% of Wave ((4)) measurement, we get a long-term target of around 146.56. This is a possible target, but please keep in mind that this is an educational study and not a trading tip or advice.
Before making any trading decisions, please conduct your own analysis or consult with a technical expert or financial consultant.
I am not Sebi registered analyst.
My studies are for educational purpose only.
Please Consult your financial advisor before trading or investing.
I am not responsible for any kinds of your profits and your losses.
Most investors treat trading as a hobby because they have a full-time job doing something else.
However, If you treat trading like a business, it will pay you like a business.
If you treat like a hobby, hobbies don't pay, they cost you...!
Hope this post is helpful to community
Thanks
RK💕
Disclaimer and Risk Warning.
The analysis and discussion provided on in.tradingview.com/u/RK_Chaarts/ is intended for educational purposes only and should not be relied upon for trading decisions. RK_Chaarts is not an investment adviser and the information provided here should not be taken as professional investment advice. Before buying or selling any investments, securities, or precious metals, it is recommended that you conduct your own due diligence. RK_Chaarts does not share in your profits and will not take responsibility for any losses you may incur. So Please Consult your financial advisor before trading or investing.
Welcome to RK_Chaarts,
Today we're going Analyze the chart of " HASBRO. " to identify a trend change opportunity.(Educational Post).
Let's get started!
Today, we analyzed the weekly chart of "HASBRO" using Elliott Waves theory and chart patterns. We clearly observed that the July 2019 top, with a high of 126.87, completed a primary degree Wave ((3)) in Black. The recent bottom in November 2023, around 42.69, marked the end of primary degree Wave ((4)) in Black. Since then, the price has formed a higher high and low, indicating a potential reversal.
The recent weekly candle close has broken out of the Resistance trendline and also confirmed an inverted head and shoulders breakout along with good breakout in RSI on weekly-cum-monthly time frames. This suggests that we may be unfolding a primary degree Wave ((5)) in Black, which should consist of five sub-divisions of Intermidiete degree in Blue. Based on the chart, it appears that Intermidiete degree Waves (1) and (2) in Blue are complete, and Wave (3) may have started.
Resistance Trendline Breakout with Inverted Head n Shoulder Breakout
RSI Breakout on Weekly
RSI Breakout on Monthly
Major EMAs Support on Daily, Weekly & Monthly
Both Elliott Wave theory, EMAs support, Trendline Breakout and chart pattern Breakout indicates that the price is likely to move higher from here. However, please note that technical analysis is a game of probabilities, and there's always a chance of being wrong.
To mitigate this risk, we've marked an invalidation level around 42.69. If this level is breached, our analysis would be invalidated.
Projecting the target for Wave ((5)) using the 123.6% of Wave ((4)) measurement, we get a long-term target of around 146.56. This is a possible target, but please keep in mind that this is an educational study and not a trading tip or advice.
Before making any trading decisions, please conduct your own analysis or consult with a technical expert or financial consultant.
I am not Sebi registered analyst.
My studies are for educational purpose only.
Please Consult your financial advisor before trading or investing.
I am not responsible for any kinds of your profits and your losses.
Most investors treat trading as a hobby because they have a full-time job doing something else.
However, If you treat trading like a business, it will pay you like a business.
If you treat like a hobby, hobbies don't pay, they cost you...!
Hope this post is helpful to community
Thanks
RK💕
Disclaimer and Risk Warning.
The analysis and discussion provided on in.tradingview.com/u/RK_Chaarts/ is intended for educational purposes only and should not be relied upon for trading decisions. RK_Chaarts is not an investment adviser and the information provided here should not be taken as professional investment advice. Before buying or selling any investments, securities, or precious metals, it is recommended that you conduct your own due diligence. RK_Chaarts does not share in your profits and will not take responsibility for any losses you may incur. So Please Consult your financial advisor before trading or investing.
YouTube: youtube.com/@rk_charts
Telegram : t.me/RK_Charts
Twitter : @charts_rk
Email : rkcharts@gmail. com
Disclaimer.
I am not sebi registered analyst.
My studies are for educational purpose only.
Telegram : t.me/RK_Charts
Twitter : @charts_rk
Email : rkcharts@gmail. com
Disclaimer.
I am not sebi registered analyst.
My studies are for educational purpose only.
Related publications
Disclaimer
The information and publications are not meant to be, and do not constitute, financial, investment, trading, or other types of advice or recommendations supplied or endorsed by TradingView. Read more in the Terms of Use.