Bullish daily line chart above / Potentially bearish 4H line chart below if conditions not met soon:
Bullish:
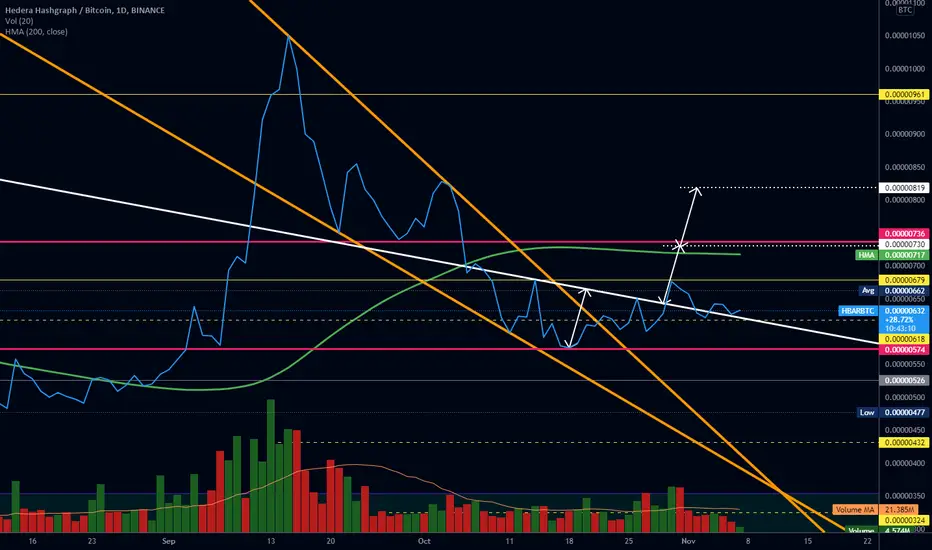
In the bullish light, we've broken out of our daily falling wedge and moved relatively sideways since. There is now an HSi on the chart that has broken above its neckline, dipped back below unsuccessfully, and is now back above.
That pattern indicates short term bullish targets of 730 sats -> 819.
- Initial target @ 730 sats target lines up closely with our 200 day HMA and our resistance at 736.
- Also, 819 approaches our old ATH area of 864 sats, which would be our target on the 4H chart if it can get and stay above its neckline. If it can't, we may see a bearish move, more below.
Bearish:
However, there's still a bearish scenario that could play out here as well:
Our 4H chart HSi is still below its neckline (see below) and needs to get above ~640 or it could look like a failed HSi.
- A failed HSi might send us down to old support areas and the top of our daily wedge around or just under ~400 sats.
- Our min target in the bearish HSi failure would be @ ~500 or just below.

Bullish:
In the bullish light, we've broken out of our daily falling wedge and moved relatively sideways since. There is now an HSi on the chart that has broken above its neckline, dipped back below unsuccessfully, and is now back above.
That pattern indicates short term bullish targets of 730 sats -> 819.
- Initial target @ 730 sats target lines up closely with our 200 day HMA and our resistance at 736.
- Also, 819 approaches our old ATH area of 864 sats, which would be our target on the 4H chart if it can get and stay above its neckline. If it can't, we may see a bearish move, more below.
Bearish:
However, there's still a bearish scenario that could play out here as well:
Our 4H chart HSi is still below its neckline (see below) and needs to get above ~640 or it could look like a failed HSi.
- A failed HSi might send us down to old support areas and the top of our daily wedge around or just under ~400 sats.
- Our min target in the bearish HSi failure would be @ ~500 or just below.
Note
TP 1 reachedDisclaimer
The information and publications are not meant to be, and do not constitute, financial, investment, trading, or other types of advice or recommendations supplied or endorsed by TradingView. Read more in the Terms of Use.
Disclaimer
The information and publications are not meant to be, and do not constitute, financial, investment, trading, or other types of advice or recommendations supplied or endorsed by TradingView. Read more in the Terms of Use.