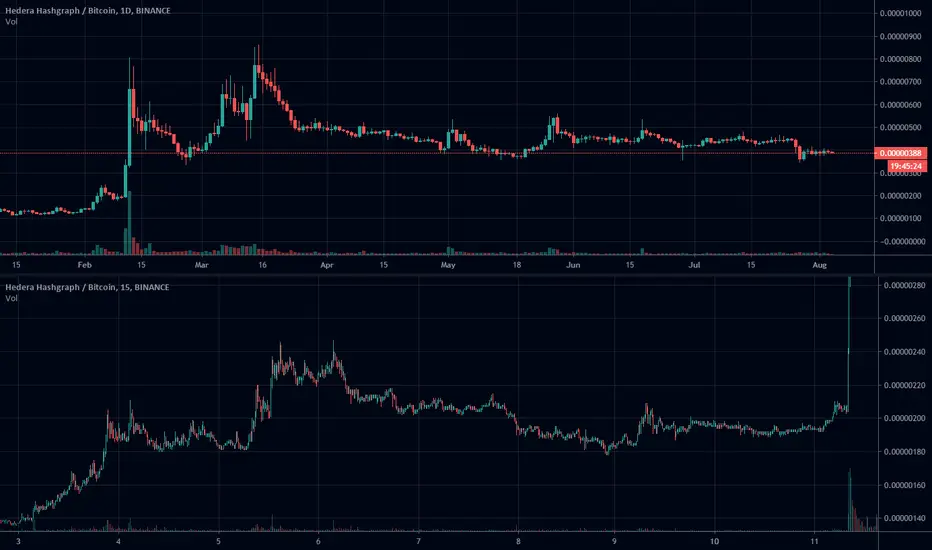
Observing / comparing the following shows an incredibly similar pattern with each other:
- Top: HBAR / BTC current daily chart
- Bottom: HBAR / BTC chart pattern printed on shorter timeframes during the rise from 114 - 865 sats in early to mid February
Disclaimer
The information and publications are not meant to be, and do not constitute, financial, investment, trading, or other types of advice or recommendations supplied or endorsed by TradingView. Read more in the Terms of Use.
Disclaimer
The information and publications are not meant to be, and do not constitute, financial, investment, trading, or other types of advice or recommendations supplied or endorsed by TradingView. Read more in the Terms of Use.