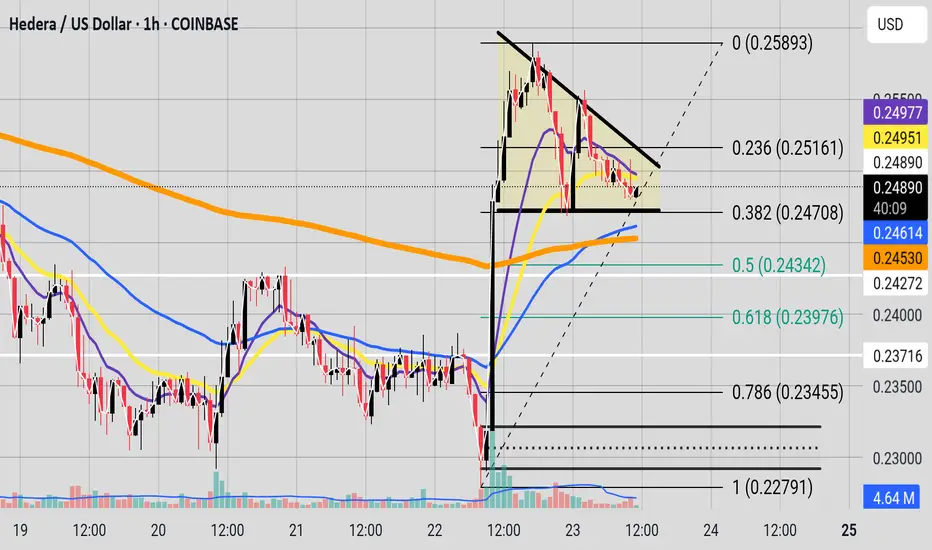
Descending triangle forming on the hourly.
Price pull back to the 0.382 Fibonacci Zone; and then started to make a descending triangle.
We have a EMA stack, and recently the 50 EMA crossed over the 200 EMA. Let us keep an eye on the descending triangle, and watch out for the direction of the Breakout or more consolidation.
Price pull back to the 0.382 Fibonacci Zone; and then started to make a descending triangle.
We have a EMA stack, and recently the 50 EMA crossed over the 200 EMA. Let us keep an eye on the descending triangle, and watch out for the direction of the Breakout or more consolidation.
Disclaimer
The information and publications are not meant to be, and do not constitute, financial, investment, trading, or other types of advice or recommendations supplied or endorsed by TradingView. Read more in the Terms of Use.
Disclaimer
The information and publications are not meant to be, and do not constitute, financial, investment, trading, or other types of advice or recommendations supplied or endorsed by TradingView. Read more in the Terms of Use.