👋 Welcome to TradeCity Pro!
In this analysis, I’m going to review the HBAR coin for you—one of the RWA and Layer1 crypto projects, currently ranked 16 on CoinMarketCap with a market cap of 9.95 billion dollars.
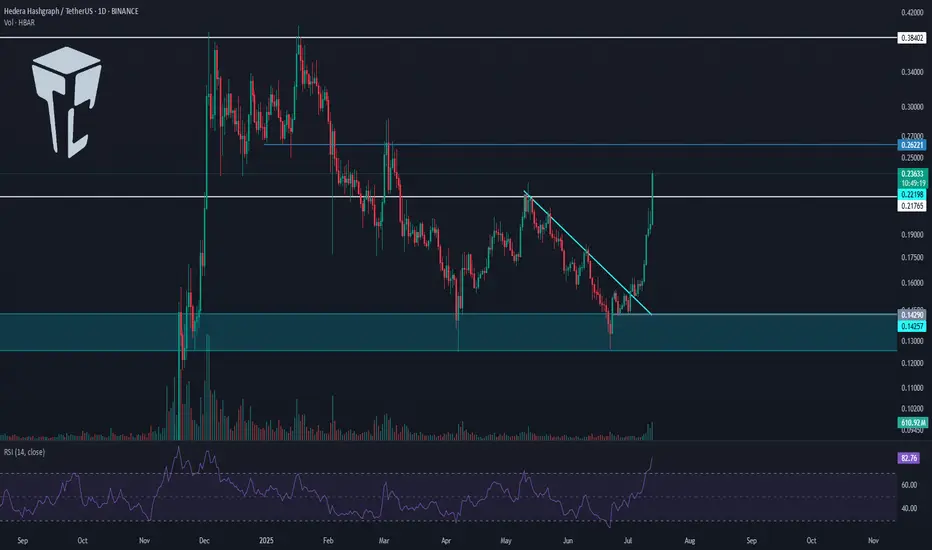
📅 Daily Timeframe
On the daily chart, as you can see, after a bullish rally toward the end of 2024, HBAR entered a corrective phase and is currently still in this correction.
✨ A major support zone (highlighted on the chart) was established, and a range box was formed between this zone and 0.21765 where price had been consolidating.
💥 There was also a descending trendline within this box that the price recently broke through, triggering strong bullish momentum. The price has now even broken above the 0.21765 level.
✔️ A significant increase in buying volume has entered the market, and with RSI entering the Overbuy zone, this move looks poised to continue even more sharply.
🔔 If this bullish momentum persists, the next targets are 0.26221 and 0.38402. If you already have an open position, these levels could be suitable for partial profit-taking.
🛒 If you're looking to buy this coin in spot, the breakout and confirmation above 0.21765 is a decent entry. However, the current stop-loss range is quite wide, so reaching a good risk-to-reward ratio might take longer with this trigger.
📈 The next potential spot triggers are 0.26221 and 0.38402. A breakout above 0.38402 would likely signal the start of a new major bullish leg.
📝 Final Thoughts
This analysis reflects our opinions and is not financial advice.
Share your thoughts in the comments, and don’t forget to share this analysis with your friends! ❤️
In this analysis, I’m going to review the HBAR coin for you—one of the RWA and Layer1 crypto projects, currently ranked 16 on CoinMarketCap with a market cap of 9.95 billion dollars.
📅 Daily Timeframe
On the daily chart, as you can see, after a bullish rally toward the end of 2024, HBAR entered a corrective phase and is currently still in this correction.
✨ A major support zone (highlighted on the chart) was established, and a range box was formed between this zone and 0.21765 where price had been consolidating.
💥 There was also a descending trendline within this box that the price recently broke through, triggering strong bullish momentum. The price has now even broken above the 0.21765 level.
✔️ A significant increase in buying volume has entered the market, and with RSI entering the Overbuy zone, this move looks poised to continue even more sharply.
🔔 If this bullish momentum persists, the next targets are 0.26221 and 0.38402. If you already have an open position, these levels could be suitable for partial profit-taking.
🛒 If you're looking to buy this coin in spot, the breakout and confirmation above 0.21765 is a decent entry. However, the current stop-loss range is quite wide, so reaching a good risk-to-reward ratio might take longer with this trigger.
📈 The next potential spot triggers are 0.26221 and 0.38402. A breakout above 0.38402 would likely signal the start of a new major bullish leg.
📝 Final Thoughts
This analysis reflects our opinions and is not financial advice.
Share your thoughts in the comments, and don’t forget to share this analysis with your friends! ❤️
💥 Don’t Miss Out!
🏆 Best Crypto Exchange: bitunix.com/register?vipCode=TCPINT
💰 Join the Telegram Channel Now: t.me/Tradecityproint
🤵 Business Contact: Tradecityproteam@gmail.com
🏆 Best Crypto Exchange: bitunix.com/register?vipCode=TCPINT
💰 Join the Telegram Channel Now: t.me/Tradecityproint
🤵 Business Contact: Tradecityproteam@gmail.com
Disclaimer
The information and publications are not meant to be, and do not constitute, financial, investment, trading, or other types of advice or recommendations supplied or endorsed by TradingView. Read more in the Terms of Use.