Hedera Hashgraph is a wonderful project that had a beautiful performance lately by the hype on socials.
Lately it got a big healty correction, unfornately entered to a downtrend channel that is going almost perfect.
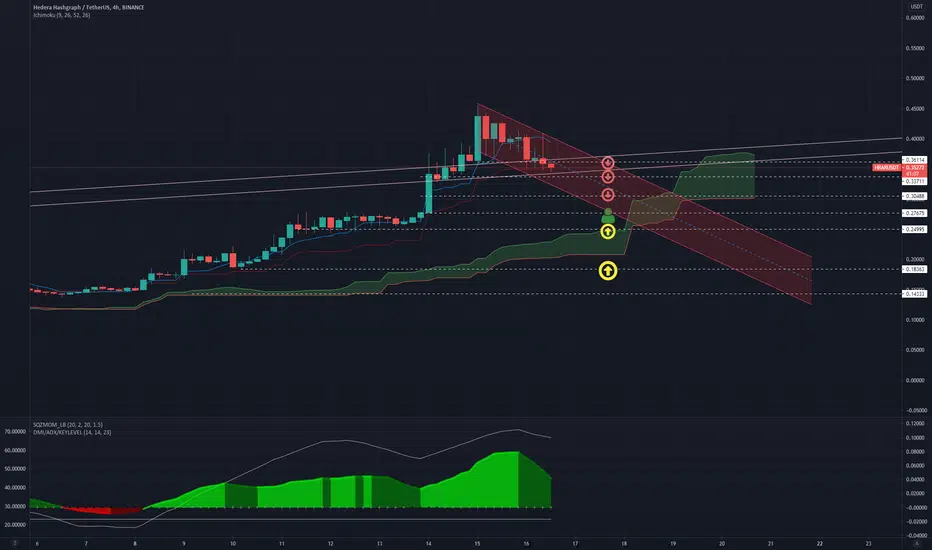
I used fibonacci, ichomoku cloud and found the hidden supports/resistances where i found great points to buy if it bounces.
The red symbols are possible supports where it can bounce but i believe that we have room to keep breaking supports until found the yellow arrows where it can seat on a strong support that fits the supply/demmand region and there we can start a big reversal with the best entry profits.
Something similar is happening with BTC with a support on 52k and also with XEM/USDT that got a big support at 0.32 and now is at 0,40.
Remember BTC moves whole market so to follow my analysis take in consideration that BTC is correcting when it start to run maybe all the alts will follow a bit later.
Lately it got a big healty correction, unfornately entered to a downtrend channel that is going almost perfect.
I used fibonacci, ichomoku cloud and found the hidden supports/resistances where i found great points to buy if it bounces.
The red symbols are possible supports where it can bounce but i believe that we have room to keep breaking supports until found the yellow arrows where it can seat on a strong support that fits the supply/demmand region and there we can start a big reversal with the best entry profits.
Something similar is happening with BTC with a support on 52k and also with XEM/USDT that got a big support at 0.32 and now is at 0,40.
Remember BTC moves whole market so to follow my analysis take in consideration that BTC is correcting when it start to run maybe all the alts will follow a bit later.
Disclaimer
The information and publications are not meant to be, and do not constitute, financial, investment, trading, or other types of advice or recommendations supplied or endorsed by TradingView. Read more in the Terms of Use.
Disclaimer
The information and publications are not meant to be, and do not constitute, financial, investment, trading, or other types of advice or recommendations supplied or endorsed by TradingView. Read more in the Terms of Use.