HBAR is the utility and security token of the Hedera network, a high-performance distributed ledger that aims to be a faster, fairer, and more secure alternative to traditional blockchains, specifically designed to meet the needs of mainstream and enterprise-level applications.
Chart Pattern Analysis
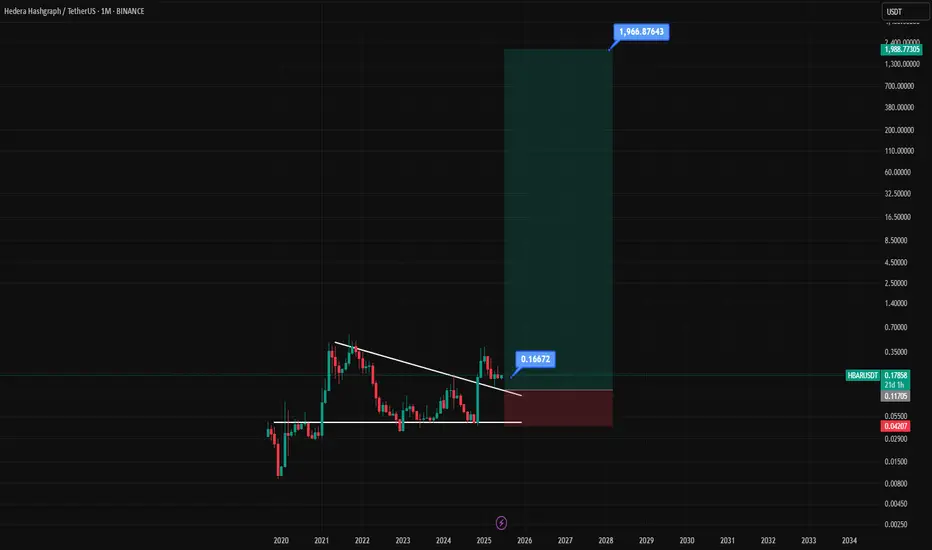
Major Pattern: Descending Triangle
The most significant pattern on this monthly chart is a large descending triangle that has been forming since late 2021.
The upper boundary is a descending trendline connecting the lower highs.
The lower boundary is a strong horizontal support line around the $0.042 level, which was tested and held multiple times throughout 2023.
Bullish Breakout and Retest
In early 2025 (according to the chart's timeline), the price has decisively broken out of the top of this descending triangle. A breakout from such a long-term consolidation pattern is typically a very strong bullish signal.
Following the breakout, the price seems to be performing a retest. It has come back down to touch the former resistance trendline, which is now acting as new support. This is a classic technical move that confirms the strength of the breakout.
Candlestick Analysis
The breakout candle is a strong, full-bodied green candle, indicating significant buying pressure and conviction behind the move.
The most recent candles are consolidating above the breakout level, holding the new support. This suggests that buyers are absorbing any selling pressure and preparing for the next move higher.
Price Prediction
Based on this technical setup, the outlook for HBAR is bullish.
Short-Term to Medium-Term: After successfully holding the retest of the broken trendline, the price is poised to continue its upward trend. The first major target would be the previous all-time high from 2021 (around $0.57).
Long-Term Projection: The analyst who created the chart has plotted a very ambitious long-term target at $1,966.87643. This is likely a calculated "measured move" of the triangle pattern, projected upwards from the breakout point. While the pattern itself is very bullish, this specific target is extremely optimistic and would represent a massive, multi-year bull run.
Summary
The chart suggests that HBAR has completed a long bearish/consolidation phase and has begun a new major uptrend. The breakout from the multi-year descending triangle, confirmed by a successful retest, is a powerful signal for future price appreciation.
The price is expected to go up. The immediate trajectory is likely continued upward movement, with key historical resistance levels as initial targets. The extremely high long-term target should be viewed as a highly speculative, best-case scenario.
Key Levels to Watch:
Support: The descending trendline (currently around 0.12−0.15) and the horizontal support at $0.11705.
Invalidation Point: A decisive drop back below the major support level at $0.04207 would invalidate this bullish thesis.
Chart Pattern Analysis
Major Pattern: Descending Triangle
The most significant pattern on this monthly chart is a large descending triangle that has been forming since late 2021.
The upper boundary is a descending trendline connecting the lower highs.
The lower boundary is a strong horizontal support line around the $0.042 level, which was tested and held multiple times throughout 2023.
Bullish Breakout and Retest
In early 2025 (according to the chart's timeline), the price has decisively broken out of the top of this descending triangle. A breakout from such a long-term consolidation pattern is typically a very strong bullish signal.
Following the breakout, the price seems to be performing a retest. It has come back down to touch the former resistance trendline, which is now acting as new support. This is a classic technical move that confirms the strength of the breakout.
Candlestick Analysis
The breakout candle is a strong, full-bodied green candle, indicating significant buying pressure and conviction behind the move.
The most recent candles are consolidating above the breakout level, holding the new support. This suggests that buyers are absorbing any selling pressure and preparing for the next move higher.
Price Prediction
Based on this technical setup, the outlook for HBAR is bullish.
Short-Term to Medium-Term: After successfully holding the retest of the broken trendline, the price is poised to continue its upward trend. The first major target would be the previous all-time high from 2021 (around $0.57).
Long-Term Projection: The analyst who created the chart has plotted a very ambitious long-term target at $1,966.87643. This is likely a calculated "measured move" of the triangle pattern, projected upwards from the breakout point. While the pattern itself is very bullish, this specific target is extremely optimistic and would represent a massive, multi-year bull run.
Summary
The chart suggests that HBAR has completed a long bearish/consolidation phase and has begun a new major uptrend. The breakout from the multi-year descending triangle, confirmed by a successful retest, is a powerful signal for future price appreciation.
The price is expected to go up. The immediate trajectory is likely continued upward movement, with key historical resistance levels as initial targets. The extremely high long-term target should be viewed as a highly speculative, best-case scenario.
Key Levels to Watch:
Support: The descending trendline (currently around 0.12−0.15) and the horizontal support at $0.11705.
Invalidation Point: A decisive drop back below the major support level at $0.04207 would invalidate this bullish thesis.
Disclaimer
The information and publications are not meant to be, and do not constitute, financial, investment, trading, or other types of advice or recommendations supplied or endorsed by TradingView. Read more in the Terms of Use.
Disclaimer
The information and publications are not meant to be, and do not constitute, financial, investment, trading, or other types of advice or recommendations supplied or endorsed by TradingView. Read more in the Terms of Use.