Hello?
Traders, welcome.
If you "Follow", you can always get new information quickly.
Please also click "Boost".
Have a good day.
-------------------------------------
(HBARUSDT 1M Chart)

The question is whether it can rise above 0.0731.
(1W chart)

If price holds above 0.0731, it will enter a sharp volatility zone with few support and resistance zones.
Therefore, the key is whether it can receive support around 0.0613 and rise.
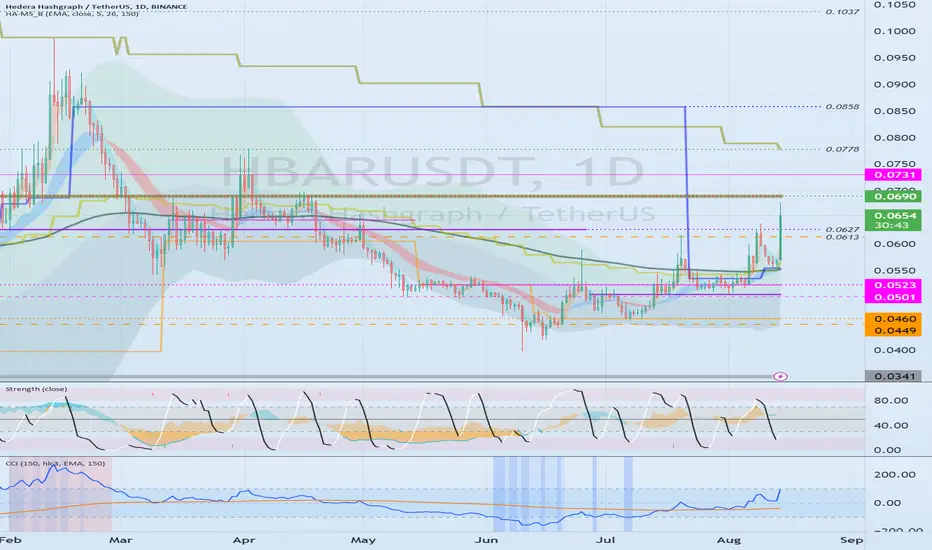
(1D chart)

Whatever the picture, the full-fledged rise is expected to begin when it rises above 0.1037.
Therefore, it is important to check the support around 0.0613-0.0731.
-------------------------------------------------- -------------------------------------------
** All descriptions are for reference only and do not guarantee profit or loss in investment.
** The trading volume indicator is displayed as a candle body based on 10EMA.
Display method (in order of boldest)
More than 3x 10EMA trading volume > 2.5x > 2.0x > 1.25x > trading volume below 10EMA
** Even if you know other people's know-how, it takes a considerable period of time to make it your own.
** This is a chart created with my know-how.
---------------------------------
Traders, welcome.
If you "Follow", you can always get new information quickly.
Please also click "Boost".
Have a good day.
-------------------------------------
(HBARUSDT 1M Chart)
The question is whether it can rise above 0.0731.
(1W chart)
If price holds above 0.0731, it will enter a sharp volatility zone with few support and resistance zones.
Therefore, the key is whether it can receive support around 0.0613 and rise.
(1D chart)
Whatever the picture, the full-fledged rise is expected to begin when it rises above 0.1037.
Therefore, it is important to check the support around 0.0613-0.0731.
-------------------------------------------------- -------------------------------------------
** All descriptions are for reference only and do not guarantee profit or loss in investment.
** The trading volume indicator is displayed as a candle body based on 10EMA.
Display method (in order of boldest)
More than 3x 10EMA trading volume > 2.5x > 2.0x > 1.25x > trading volume below 10EMA
** Even if you know other people's know-how, it takes a considerable period of time to make it your own.
** This is a chart created with my know-how.
---------------------------------
Note
(HBARUSDT chart)To continue the uptrend, the price needs to rise above 0.0731 to sustain it.
If not, you should check for support around 0.0613-0.0645.
Other content (coins, stocks, etc.) is frequently posted on X.
X에 다른 내용(코인, 주식 등)이 자주 게시.
◆ t.me/readCryptoChannel
[HA-MS Indicator]
bit.ly/3YxHgvN
[OBV Indicator]
bit.ly/4dcyny3
X에 다른 내용(코인, 주식 등)이 자주 게시.
◆ t.me/readCryptoChannel
[HA-MS Indicator]
bit.ly/3YxHgvN
[OBV Indicator]
bit.ly/4dcyny3
Related publications
Disclaimer
The information and publications are not meant to be, and do not constitute, financial, investment, trading, or other types of advice or recommendations supplied or endorsed by TradingView. Read more in the Terms of Use.