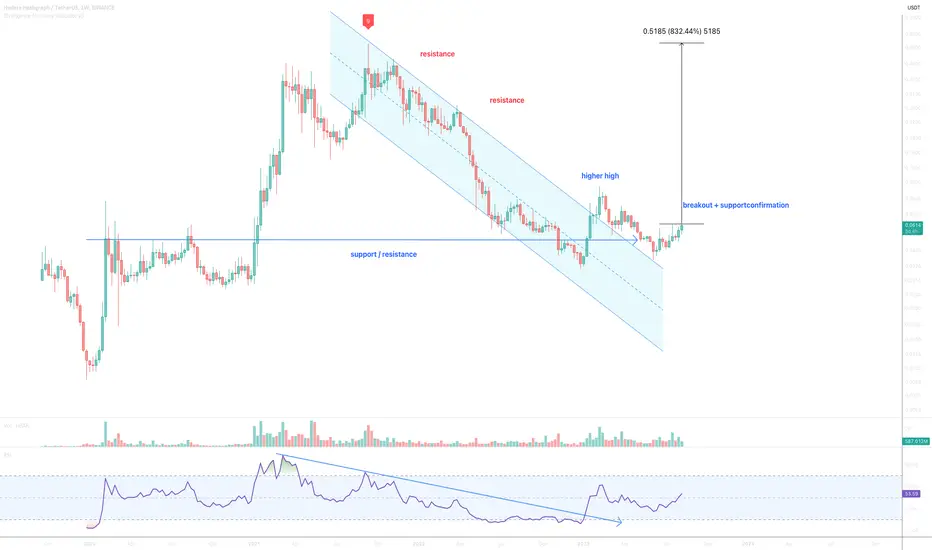
On the above weekly chart price action has corrected over 90% since the sell signal (not shown). Today is great long opportunity. Why?
1) RSI and price action resistance breakout with support confirmation.
2) Multiple oscillators print bullish divergence.
3) Trend reversal. Higher highs higher lows replace lower highs lower lows.
4) The macro bull-flag confirmation prints the 50 cent target.
Is it possible price action falls further? Sure.
Is it probable? No.
Ww
Type: trade
Risk: <=6% of portfolio
Timeframe: Now, don’t sit on your hands.
Return: 8x
Trade active
Note
close short positions if you've got them open....Trade active
GRM support confirmed!Trade active
Double bottom confirmedNote
past resistance confirms support, hold now until 50 centsTrade active
Fans of this beleaguered sideways trading token your attention is required.Were sellers to know of what was coming next month and the month after that the sell side order book would evaporate.
Be the 10%...
Ps: I'm not trading holding investing in this, you must ask elsewhere for updates.
18hr chart
Note
Were you the 10% ?? Did you act?
Trade active
An excellent moment to long.Note
Trade remains active, hold until over $1Note
Very overbought.... very.6 day chart
Note
Almost at target area.Don't be the 90%...
BTC
bc1q2eckdzh0q8vsd7swcc8et6ze7s99khhxyl7zwy
Weblink: patreon.com/withoutworries
Allow 3-6 months on ideas. Not investment advice. DYOR
bc1q2eckdzh0q8vsd7swcc8et6ze7s99khhxyl7zwy
Weblink: patreon.com/withoutworries
Allow 3-6 months on ideas. Not investment advice. DYOR
Disclaimer
The information and publications are not meant to be, and do not constitute, financial, investment, trading, or other types of advice or recommendations supplied or endorsed by TradingView. Read more in the Terms of Use.