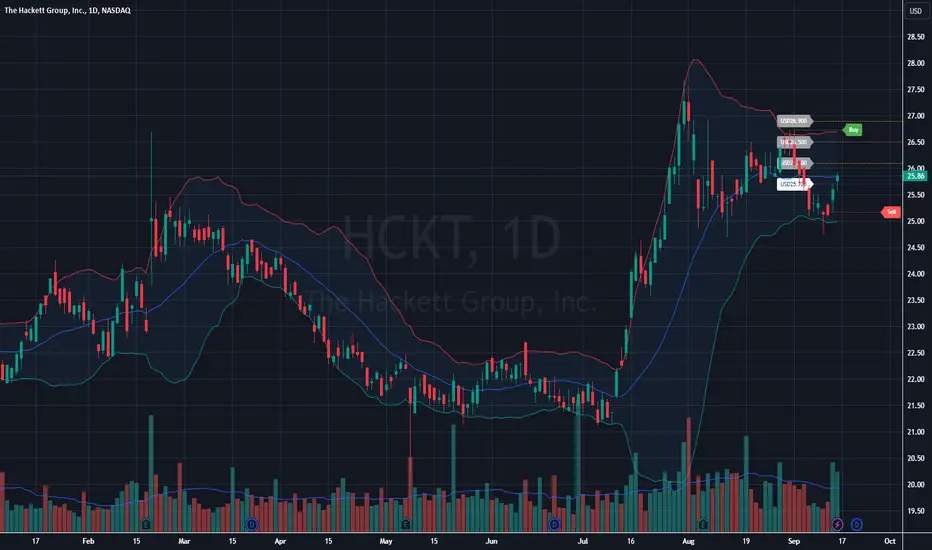
- Middle Band (SMA): The price is currently trading around this line, which typically represents a moving average, suggesting equilibrium between buyers and sellers at this level.
- Current situation: The price is consolidating around $25.86, slightly above the 20-period simple moving average, indicating that bulls are trying to hold this level.
- Resistance: A strong resistance can be seen around the $27.50-$28 range, which aligns with the recent highs.
- Support: The $25.00 level, which aligns with the middle Bollinger Band, serves as a potential support level. Below this, there is support around $23.00.
- The recent decline in volume suggests weakening momentum, which could indicate a period of consolidation or a potential reversal.
- Bullish Case: If the price breaks above $27.50, it may attempt to retest the previous highs around $28 or higher.
- Bearish Case: A failure to hold the $25.00 support level might lead to a drop toward the lower Bollinger Band around $23.00.
- The current consolidation phase around $25.86 suggests that the market is indecisive, and watching how the price reacts to support/resistance levels will give a clearer direction.
➀➁➂➃➄
Disclaimer
The information and publications are not meant to be, and do not constitute, financial, investment, trading, or other types of advice or recommendations supplied or endorsed by TradingView. Read more in the Terms of Use.
➀➁➂➃➄
Disclaimer
The information and publications are not meant to be, and do not constitute, financial, investment, trading, or other types of advice or recommendations supplied or endorsed by TradingView. Read more in the Terms of Use.