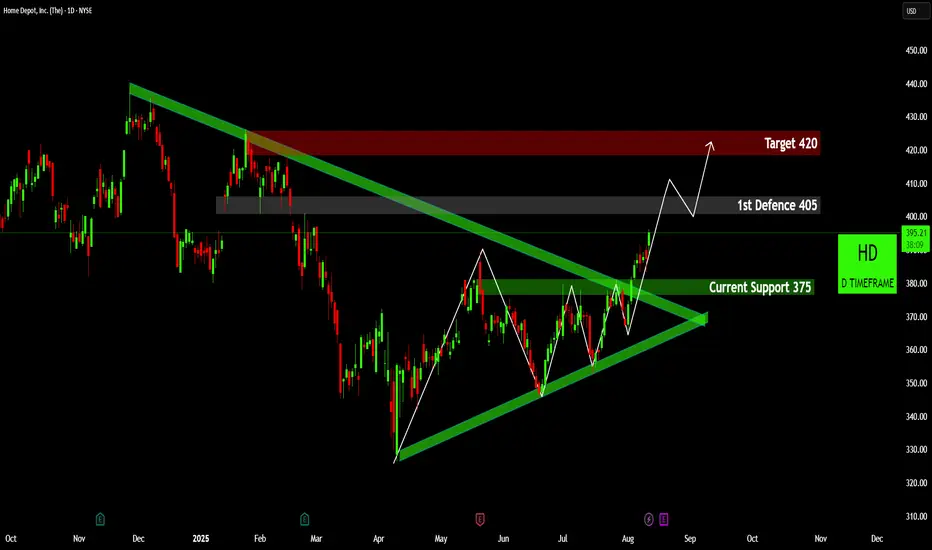
•Decisive Pattern Breakout: Home Depot has executed a robust bullish breakout from a multi-month symmetrical triangle pattern. This pattern, clearly defined by the converging vibrant green trendlines, indicates a period of consolidation followed by a strong directional move. The recent surge above the upper trendline signals a decisive shift in market sentiment towards the bullish side. 💪
•Establishing Firm Support: Crucially, the previous resistance level around $375, now highlighted as a green support zone, has been successfully retested and held. This conversion of resistance into support is a classic bullish confirmation, providing a solid foundation for the subsequent advance. Maintaining price action above this level is paramount for the continuation of the upward trajectory. 💎
•Navigating Immediate Hurdles: As the rally progresses, the price is approaching its "1st Defense" around $405, a grey zone representing an immediate resistance hurdle. A successful breach of this level, potentially after some consolidation or minor pullback, would open the gates for the next leg higher. 📊
•Targeting the Next Milestone: With the breakout confirmed and key support in place, our technical analysis projects a significant upside target of $420. This objective, marked by the prominent red zone, aligns with the measured move of the symmetrical triangle pattern and previous areas of price action. Traders will be keenly observing for a sustained drive towards this ambitious level. 🎯
•Strong Bullish Momentum: The overall outlook for HD is bullish. The recent price action, underpinned by the powerful pattern breakout and the establishment of robust support, points to strong underlying demand. As long as the price maintains its position above the $375 level, the path of least resistance remains to the upside. ✨
Disclaimer:
The information provided in this chart is for educational and informational purposes only and should not be considered as investment advice. Trading and investing involve substantial risk and are not suitable for every investor. You should carefully consider your financial situation and consult with a financial advisor before making any investment decisions. The creator of this chart does not guarantee any specific outcome or profit and is not responsible for any losses incurred as a result of using this information. Past performance is not indicative of future results. Use this information at your own risk. This chart has been created for my own improvement in Trading and Investment Analysis. Please do your own analysis before any investments.
Disclaimer
The information and publications are not meant to be, and do not constitute, financial, investment, trading, or other types of advice or recommendations supplied or endorsed by TradingView. Read more in the Terms of Use.
Disclaimer
The information and publications are not meant to be, and do not constitute, financial, investment, trading, or other types of advice or recommendations supplied or endorsed by TradingView. Read more in the Terms of Use.