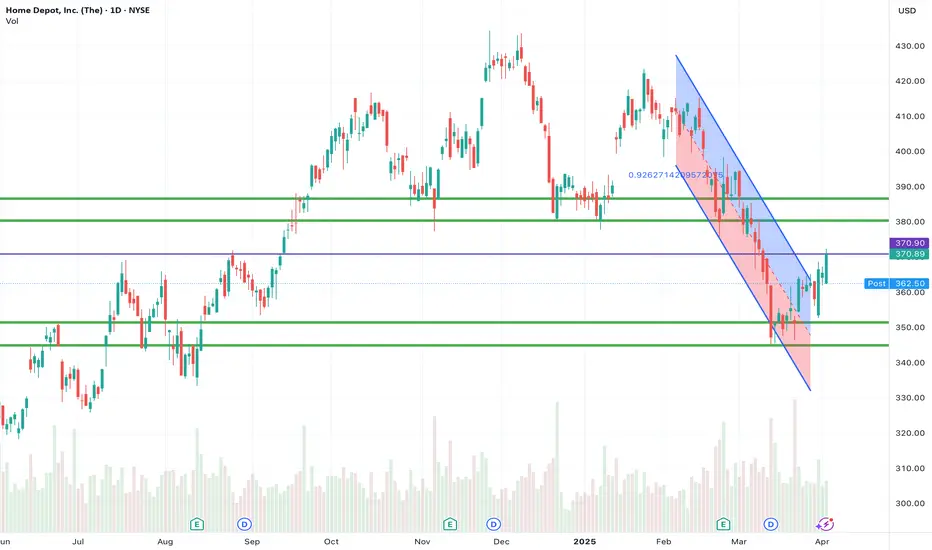
Home Depot's chart shows it just broke out of a descending channel! After a steady downtrend, it's pushing past resistance around $370. Is this the start of a sustained rally, or a temporary blip before it heads back down? Keep an eye on the next resistance level near $383 – a break above that would strengthen the bullish case. Are you betting on HD's strength, or seeing a potential pullback?
Disclaimer
The information and publications are not meant to be, and do not constitute, financial, investment, trading, or other types of advice or recommendations supplied or endorsed by TradingView. Read more in the Terms of Use.
Disclaimer
The information and publications are not meant to be, and do not constitute, financial, investment, trading, or other types of advice or recommendations supplied or endorsed by TradingView. Read more in the Terms of Use.