Hello, traders.
If you "Follow", you can always get new information quickly.
Have a nice day today.
-------------------------------------
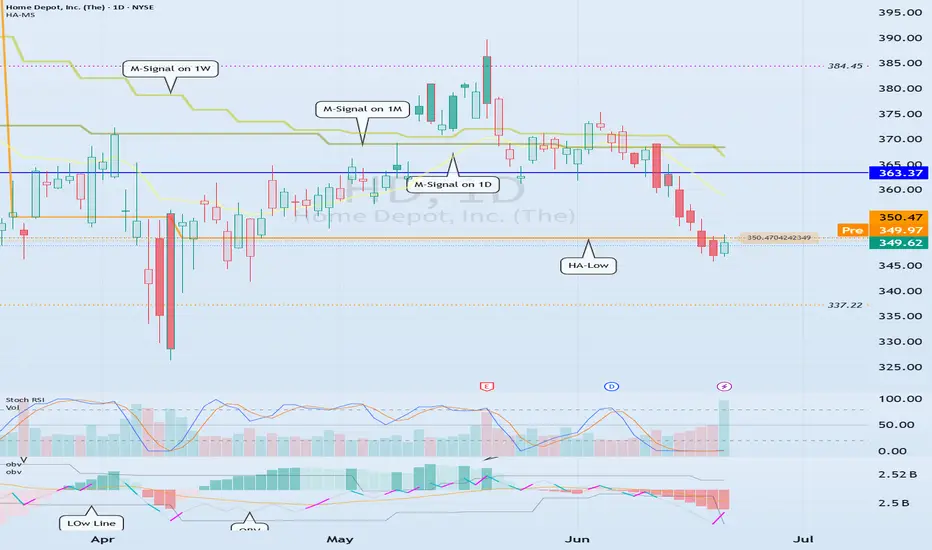
(HD 1D chart)
Can the HA-MS indicator be applied to stock charts?!!!
The conclusion is that it can be applied to all charts.
However, since the stock market is traded one week at a time, you cannot collect stocks corresponding to the profit of the coin market.
Since the coin market can be traded in decimals, you can create a medium- to long-term trading strategy by selling the purchase amount when realizing profit and collecting the number of coins (tokens) corresponding to profit.
The basic trading strategy is to buy near the HA-Low indicator and sell near the HA-High indicator.
However, when conducting short-term trading, you need to be careful to check whether the price is above or below the M-Signal indicator on the 1M chart.
If the price is below the M-Signal indicator on the 1M chart, you need to respond quickly and quickly in the form of day trading.
Therefore, it is important to find stocks that maintain their price above the M-Signal indicator on the 1M chart if possible.
If you are familiar with day trading, you can conduct trading according to the basic trading strategy regardless of the location of the M-Signal indicator on the 1M chart.
However, since the HA-Low or HA-High indicators are intermediate values, they may proceed in the opposite direction to the basic trading strategy depending on whether there is support.
In other words, if the HA-Low indicator is resisted and falls, there is a possibility of a stepwise downtrend, and if the HA-High indicator is supported and rises, there is a possibility of a stepwise uptrend.
To confirm this, you need to check the movement of the auxiliary indicator PVT-MACD oscillator indicator and the OBV indicator consisting of the Low Line ~ High Line channel.
One thing to keep in mind here is that there are differences depending on the situation, whether it is a decline or an increase.
In other words, if the HA-Low indicator declines, there is a possibility of a stepwise decline, but the end is an increase.
This means that if the HA-Low indicator shows a stepwise decline, you should focus on finding the right time to buy.
On the other hand, if the HA-High indicator rises, there is a possibility of a stepwise rise, but the end is a decline.
Therefore, if the HA-HIgh indicator shows a stepwise rise, you should focus on finding the right time to sell.
----------------------------------------------
Looking at the current price position based on the above, the price is located near the HA-Low indicator.
However, since the price is located below the M-Signal indicator on the 1M chart, it is recommended to approach the transaction in a short and fast short-term trading (day trading) manner.
The PVT-MACD oscillator indicator is showing a downward trend below the 0 point.
In other words, it should be interpreted that the selling force is dominant.
The OBV indicator is showing signs of breaking through the Low Line upward.
However, since the Low LIne ~ High Line channel is not showing an upward trend, caution is required when trading even if the price is rising until it turns into an upward trend.
Therefore, the key is whether there is support near 350.47, which is the HA-Low indicator point.
If it receives support and rises above the M-Signal indicator of the 1M chart and maintains the price, it is highly likely to turn into an upward trend.
At this time, since the HA-High indicator of the 1M chart is formed at the 363.37 point, there is a high possibility that it will act as resistance near this point.
Therefore, if you are going to make a mid- to long-term investment in this stock, it is recommended to check for support near 363.37 or near the M-Signal indicator on the 1M chart.
Otherwise, if you are thinking of buying in installments, you can buy whenever it shows support on the HA-Low indicator regardless of the M-Signal indicator on the 1M chart.
This is because the end of the stepwise downtrend on the HA-Low indicator is ultimately an uptrend.
-
Thank you for reading to the end.
I hope you have a successful transaction.
--------------------------------------------------
Other content (coins, stocks, etc.) is frequently posted on X.
X에 다른 내용(코인, 주식 등)이 자주 게시.
◆ t.me/readCryptoChannel
[HA-MS Indicator]
bit.ly/3YxHgvN
[OBV Indicator]
bit.ly/4dcyny3
X에 다른 내용(코인, 주식 등)이 자주 게시.
◆ t.me/readCryptoChannel
[HA-MS Indicator]
bit.ly/3YxHgvN
[OBV Indicator]
bit.ly/4dcyny3
Disclaimer
The information and publications are not meant to be, and do not constitute, financial, investment, trading, or other types of advice or recommendations supplied or endorsed by TradingView. Read more in the Terms of Use.