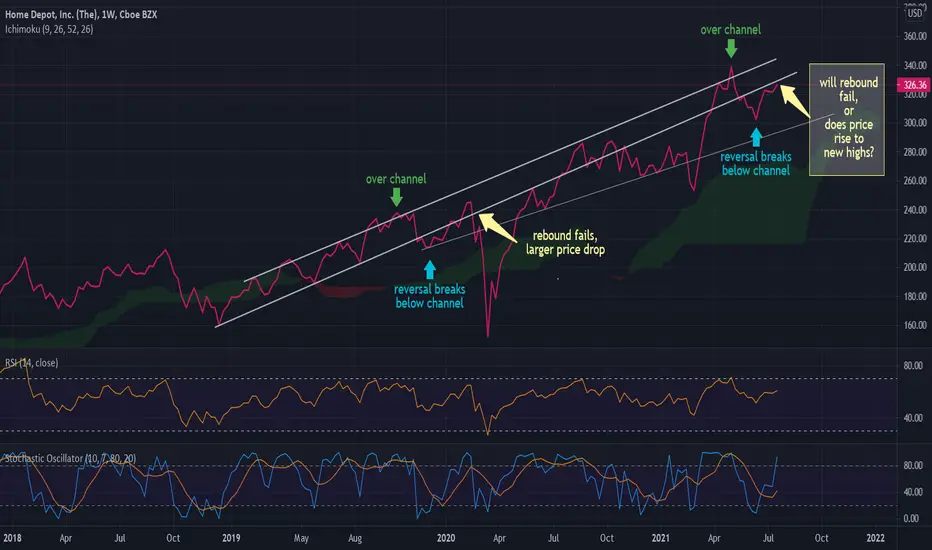
This chart follows a swing put trade idea I posted in early July (linked). I bought and sold those puts when price dropped from 322 to 318. Now I want to share this channel I found on the weekly chart, and I am wondering if the Feb. - Mar. 2020 price action will occur again? I like HD for day trades and short term swings. I prefer to keep a smaller position size so even if price moves against my option I have time and comfort to hold a loss .
On a candle chart you can draw a horizontal line at 328.50 and see this area, reached on 21 July, is resistance.
Below the two channel lines is a lower support line that provides a downside target.
Remember this is a weekly chart so look for trade entry signals like candle setups and RSI on daily/hourly timeframes.
Related publications
Disclaimer
The information and publications are not meant to be, and do not constitute, financial, investment, trading, or other types of advice or recommendations supplied or endorsed by TradingView. Read more in the Terms of Use.
Related publications
Disclaimer
The information and publications are not meant to be, and do not constitute, financial, investment, trading, or other types of advice or recommendations supplied or endorsed by TradingView. Read more in the Terms of Use.