Symmetrical Triangle Pattern Forming
A breakout or breakdown is likely soon. Price is consolidating within the triangle range.
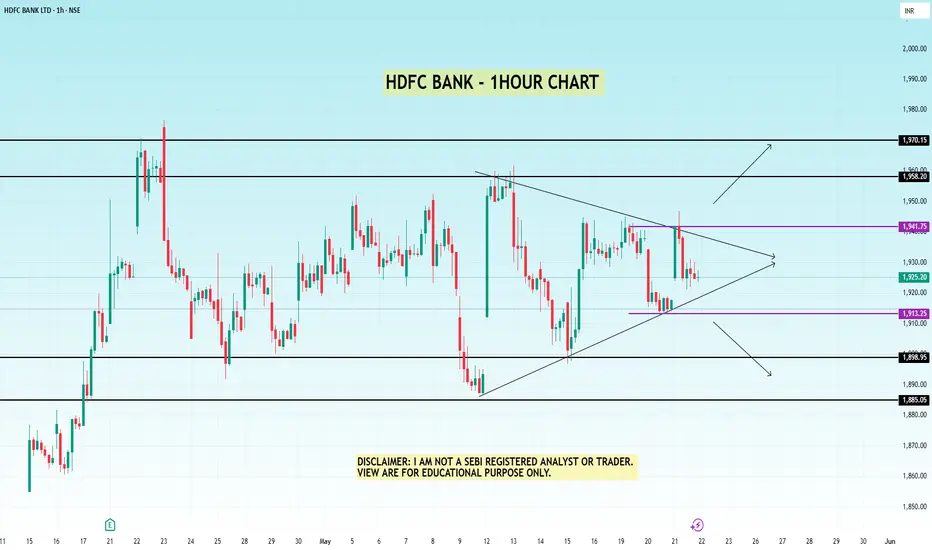
HDFC BANK ANALYSIS ON 1 HOUR TIME FRAME
IMPORTANT LEVELS TO WATCH:
Resistance: 1941 – 1958 – 1970
Support: 1913 – 1898 – 1885
📌 Chart Pattern: Price is forming a symmetrical triangle which indicates a potential breakout or breakdown.
A breakout above 1941.75 (purple line) can trigger a bullish move.
A breakdown below 1913.25 (purple line) can attract sellers.
📌 Wait for a breakout confirmation before entering a trade.
👉🏻 thetradeforecast
Trade active
Trendline breakdown done but looks like its trap for bears, situation been change now if any candle close above triangle trendline then look for bullish move till upper trendline (triangle)Trade closed: target reached
as per last update it went exactly , it was a bear trap !Disclaimer
The information and publications are not meant to be, and do not constitute, financial, investment, trading, or other types of advice or recommendations supplied or endorsed by TradingView. Read more in the Terms of Use.
Disclaimer
The information and publications are not meant to be, and do not constitute, financial, investment, trading, or other types of advice or recommendations supplied or endorsed by TradingView. Read more in the Terms of Use.