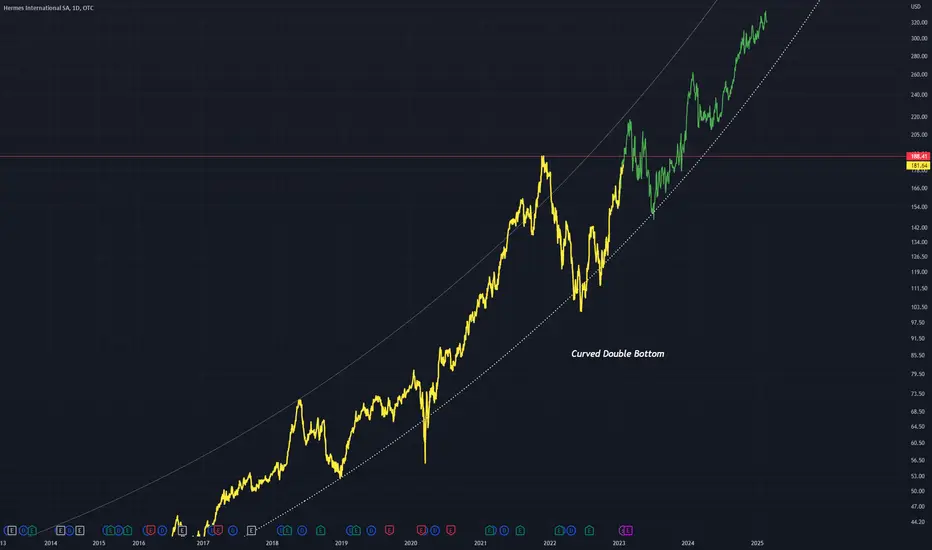
HESAY on this Logarithmic chart has gone parabolic
A slanted double bottom can be observed
This will push price up towards a double top (red horizontal)
The double top might occur but the parabolic trend will likely not break
Hence the continuation bars pattern in green
A slanted double bottom can be observed
This will push price up towards a double top (red horizontal)
The double top might occur but the parabolic trend will likely not break
Hence the continuation bars pattern in green
Disclaimer
The information and publications are not meant to be, and do not constitute, financial, investment, trading, or other types of advice or recommendations supplied or endorsed by TradingView. Read more in the Terms of Use.
Disclaimer
The information and publications are not meant to be, and do not constitute, financial, investment, trading, or other types of advice or recommendations supplied or endorsed by TradingView. Read more in the Terms of Use.