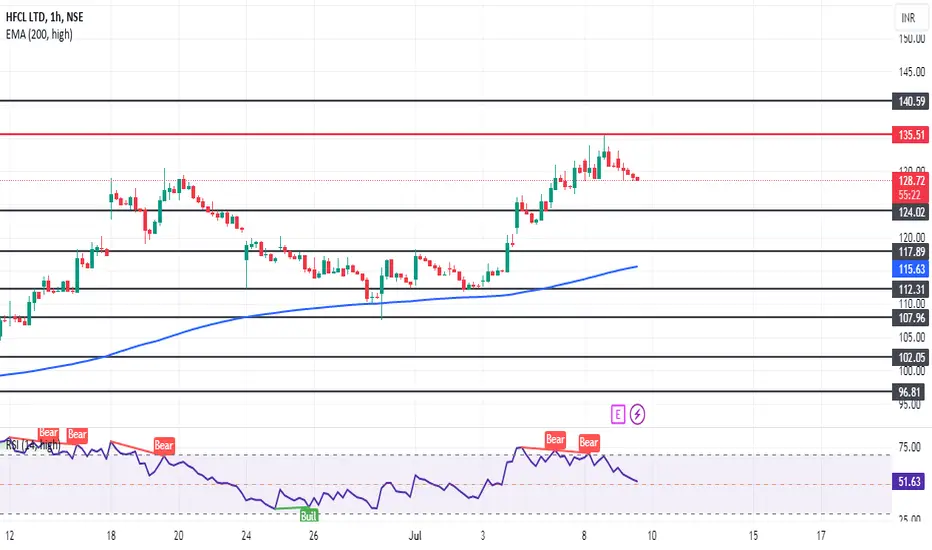
HFCL Technical Analysis:- As per previous chart history and current chart pattern, this is the best time to buy this stock as HFCL appears to be in a bullish trend based on several technical indicators.
Buy HFCL at CMP@129 or wait for a dip to enter in the buy trade.
Nearest Target: 140
Maximum Target: 200+
Here's a breakdown:
Positive Signs of HFCL:
Moving Averages: Both short-term (e.g., 15-day, 50-day) and long-term (e.g., 50-day, 200-day) moving averages are showing an upward trend, indicating bullish momentum.
PRice Action: HFCL recently made a new one-year high, signifying strong buying pressure.
Breakouts: Positive breakouts above resistance levels are observed on charts.
Oscillators: While some oscillators might provide neutral readings, others like MACD hint at a mildly bullish trend.
RSI: The Relative Strength Index (RSI) might be hovering near the overbought territory, suggesting a potential pullback in the short term.
Overall Trend of HFCL:- The technical analysis of HFCL is predominantly bullish. The moving averages, price action, and breakouts all point towards an upward trend. However, a slight caution might be warranted due to the RSI nearing overbought levels.
Here are some additional points to consider:
My Personal Opinions:- Limited data is available, but some sources suggest a target price as high as 140.00.
News and Events: Keep an eye on any relevant news or events that could impact the stock price.
Remember: This analysis is based on publicly available information and should not be considered financial advice. It's crucial to conduct your own research before making any investment decisions as I am not SEBI registered person
Thanks for your support as always
Disclaimer
The information and publications are not meant to be, and do not constitute, financial, investment, trading, or other types of advice or recommendations supplied or endorsed by TradingView. Read more in the Terms of Use.
Disclaimer
The information and publications are not meant to be, and do not constitute, financial, investment, trading, or other types of advice or recommendations supplied or endorsed by TradingView. Read more in the Terms of Use.